ptcs-chart-line
Visual
Overview
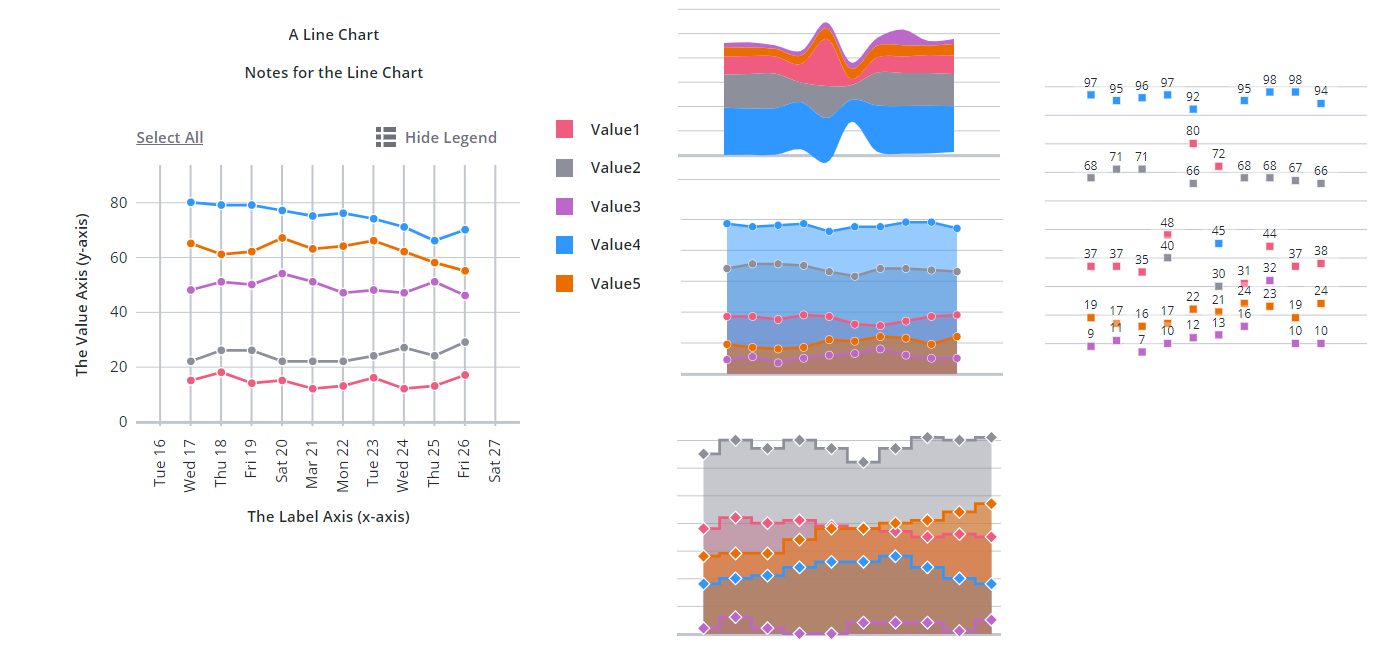
ptcs-chart-line is a compound component that enables you to visualize data as a line chart.
The line chart can display:
- lines
- areas between the line and the zero axis
- value markers, such as circles, squares, triangles, and more
- values, that are placed relative to the value marker (above, below, or on top of it)
When the chart displays several series, you can display values as independent lines, areas, or stacked. Stacked values support multiple options.
The X and Y-axis values can be numbers, string labels, or dates (i.e. JavaScript Date objects).
You can configure the line chart properties to display one of the following chart types:
- Area chart
- Line chart
- Scatter plot
- Step chart
- Streamgraph
- Time Series chart
In addition to the line chart area, ptcs-chart-line also has areas for:
- a title
- notes
- a legend
- an x-axis, and
- a y-axis
Usage Examples
Basic Usage
<ptcs-chart-line items=[[line-chart-data]]></ptcs-chart-line>
Component API
Properties
| Property | Type | Description | Default |
|---|---|---|---|
| titleLabel | String | The chart title | |
| titlePos | String | Specifies the title position. Supported values: "top", "bottom", "left", or "right" | top |
| titleAlign | String | Specifies the title alignment. Supported values: "left", "center", or "right" | center |
| titleVariant | String | The variant assigned to the title ptcs-label |
See ptcs-label |
| notesLabel | String | The notes text | |
| hideNotes | Boolean | Hide the notes? | false |
| notesPos | String | Specifies the notes position. Supported values: "top", "bottom", "left", or "right" | bottom |
| notesAlign | String | Specifies the notes alignment. Supported values: "left", "center", or "right" | center |
| xAxisLabel | String | Specifies the x-axis label | |
| xAxisAlign | String | Specifies the alignment of the x-axis label. Supported values: "left", "center", or "right" | center |
| hideXAxis | Boolean | Hide the x-axis? | false |
| NumberOfXLabels | Number | Set the number of labels on the X-axis, apply only for numeric and date format | |
| xType | String | Specifies the type of the x-values. Supported values: "number", "date", "string" | number |
| yAxisLabel | String | Specifies the y-axis label | |
| yAxisAlign | String | Specifies the alignment of the y-axis label. Supported values: "left", "center", or "right" | center |
| hideYAxis | Boolean | Hide the y-axis? | false |
| NumberOfYLabels | Number | Set the number of labels on the Y-axis, apply only for numeric and date format | |
| yType | String | Specifies the type of the y-values. Supported values: "number", "date", "string" | number |
| referenceLines | Array | An array of items with properties label, value, and axis (supported values: "xaxis" or "yaxis") for corresponding threshold lines |
|
| hideLegend | Boolean | Hide the legend? | false |
| showLegendButton | Boolean | Show a button in the Action Bar area for toggling the legend visibility? | false |
| legend | Array | Array of strings that specifies the legend names | |
| legendPos | String | Specifies the legend position. Supported values: "top", "bottom", "left", or "right" | "right" |
| legendAlign | String | Specifies the alignment of the legend. Supported values: "start", "center", or "end" | start |
| legendShape | String | Specifies the shape of the legend. Supported values: "square", "circle", "none" | square |
| filterLegend | Boolean | When true, each legend item has a checkbox that allows the user to hide or show the corresponding data | false |
| flipAxes | Boolean | Flip the positions of the x- and y-axes | false |
| flipXAxis | Boolean | Flip the position of the x-axis to the other side of the chart | false |
| flipYAxis | Boolean | Flip the position of the y-axis to the other side of the chart | false |
| showXRulers | Boolean | Show rulers that corresponds to the ticks of the x-axis | false |
| showYRulers | Boolean | Show rulers that corresponds to the ticks of the y-axis | false |
| frontRulers | Boolean | Draw rulers on top of the bars | false |
| reverseXAxis | Boolean | Reverse the order of the x-axis | false |
| reverseYAxis | Boolean | Reverse the order of the y-axis | false |
| specXMin | String | Specifies the start label of the X-axis | |
| specXMax | String | Specifies the end label of the X-axis | |
| specYMin | "baseline" or "auto" or Number | Specifies the start value of the Y-axis. "baseline": start from zero if the minimum value in the data is non-negative. Otherwise use "auto". "auto": Use the minimum value of the data and subtract 20% of the full range of the data. Number: start at specified number. | auto |
| specYMax | "auto" or Number | Specifies the end value of the Y-axis. See specYMin for details | auto |
| yAxisNumberFormatSpecifier | String | Number format (e.g. '0.00') to use on the y-axis (if the type is number) | |
| yAxisDateFormatToken | String | Date format token (e.g. 'YYYY-MM-DD') to use on the y-axis (if the type is date) | auto |
| xAxisNumberFormatSpecifier | String | Number format (e.g. '0.00') to use on the x-axis (if the type is number) | |
| xAxisDateFormatToken | String | Date format token (e.g. 'YYYY-MM-DD') to use on the x-axis (if the type is date) | auto |
| xZoomSlider | Boolean | Show X-Axis Zoom Slider? | false |
| xZoomSliderLabel | String | Specifies the label for the X-axis Zoom Slider | |
| xZoomSliderMaxLabel | String | Specifies the Maximum label for the X-axis Zoom Slider | |
| xZoomSliderMinLabel | String | Specifies the Minimum label for the X-axis Zoom Slider | |
| yZoomSlider | Boolean | Show Y-Axis Zoom Slider? | false |
| yZoomSliderLabel | String | Specifies the label for the Y-axis Zoom Slider | |
| yZoomSliderMaxLabel | String | Specifies the Maximum label for the Y-axis Zoom Slider | |
| yZoomSliderMinLabel | String | Specifies the Minimum label for the Y-axis Zoom Slider | |
| data | Array | The chart data | |
| stackMethod | String | Stack method. Only used when each x-value has several y-values. Supported values: "auto", "expand", "diverging", "silhouette", "wiggle" | Unassigned (no stacking) |
| stackOrder | String | Specifies the stacking order. Supported values: "auto", "reverse", "appearance", "ascending", "descending", "insideout" | auto |
| hideLines | Boolean | Hide the chart lines | false |
| showAreas | Boolean | Show areas under chart lines? | |
| marker | String | Specify the marker shape. Supported values: "none", "square", "circle", "triangle", "plus", "cross" | none |
| markerSize | String or Number | Specify the marker size. Supported values: "small", "medium", "large", "xlarge", number (pixels) | medium |
| showValues | String | Show values. The values are displayed relative to the marker position. Supported values: "above", "on","below" | Unassigned (hide values) |
| hideZeroRuler | Boolean | Hide the zero ruler? | false |
| curve | String | Specify the curve drawing method. Supported values: "linear", "basis", "bundle", "cardinal", "catmull-rom", "monotone-x", "monotone-y", "natural", "step" | linear |
| bundleBeta | 0 .. 1 |
Parameter when curve = "bundle" |
0.5 |
| cardinalTension | 0 .. 1 |
Parameter when curve = "cardinal" |
0.5 |
| catmullRomAlpha | 0 .. 1 |
Parameter when curve = "catmull-rom" |
0.5 |
| stepPosition | String | Parameter when curve = "step". Supported values: "center", "before", "after" |
center |
| sparkView | Boolean | Displays a chart preview by hiding certain parts such as the legend and notes areas | false |
| disabled | Boolean | Is the line chart disabled? | false |
| showY2Axis | Boolean | Adds secondary y-axis | false |
| y2Type | Specifies the type of the values displayed on the secondary y-axis. Supported values: "number", "date", "string" | number | |
| reverseY2Axis | Boolean | Reverse the order of the secondary y-axis | false |
| data2 | Array | The chart data attached to the secondary y-axis | |
| specY2Min | String | Specifies the start value of the secondary Y-axis. See specYMin for more information. | auto |
| specY2Max | String | Specifies the end value of the secondary Y-axis. See specYMin for details | auto |
| y2AxisLabel | String | Specifies the secondary y-axis label | |
| y2AxisAlign | String | Specifies the alignment of the secondary y-axis label. Supported values: "left", "center", or "right" | center |
| y2AxisNumberFormatSpecifier | String | The number format (e.g. '0.00') to use for the secondary y-axis when the axis type is number. | |
| y2AxisDateFormatToken | String | The date format token (e.g. 'YYYY-MM-DD') to use for the secondary y-axis when the axis type is date. | auto |
| yAxisRulerAlignment | String | Aligns the Y-axis rulers with the tick markers of the primary or secondary Y-axis | primary |
| selectionMode | String | Set selection mode: "none" (default) - no markers can be selected. "single" - one marker can be selected. "multiple" - any number of markers can be selected. The "multiple" option displays a link in the Action Bar area for selecting / un-selecting all markers. |
"none" |
| horizontalTicksRotation | Number | Sets the rotation of horizontal axis ticks in degrees. The allowed range is: -180 to 180. If this property is not specified, horizontal axis ticks auto-rotates 90 degrees if they collide when not rotated. | |
| tooltipTemplate | String | Custom tooltip to display when a data point on the chart is selected. You can show a title, text, data values, and create new lines. Use the following syntax: Add #title# before a string to show a title, #newline# to create a new line, ${ |
Events
| Name | Data | Description |
|---|---|---|
| series-click | Marker X value + Y Value | Click on a marker shape |
| series-click | Array of marker X value + Y Value | Click on an area of a series |
| zoom-selection | detail: {x: left, y: top, w: right - left, h: bottom - top} |
Selected area |
| chart-selection | selection | Selected data |
Styling
The Parts of a Line Chart
A ptcs-chart-line consist of these sub-components:
ptcs-chart-layout, for chart layoutsptcs-chart-legend, for chart legendptcs-chart-coord, for combining a chart with a coordinate system (adds axes and rulers)ptcs-chart-axis, for chart axesptcs-chart-core-line, for the core line chart functionalityptcs-chart-zoom, for the chart zoom controlsptcs-chart-action-bar, for theSelect All/Clear Alllink and theShow Legend/Hide Legendbutton to toggle legend visibility.
Parts
| Part | Description |
|---|---|
| chart-layout | The ptcs-chart-layout subcomponent |
| title-area | The chart title area container |
| title-label | The chart title |
| notes-area | The chart notes area container |
| notes-label | The chart notes title |
| chart | The ptcs-chart-coord subcomponent |
| core-chart | The ptcs-chart-core-line subcomponent |
| legend-area | The legend area container |
| legend | The ptcs-chart-legend subcomponent |
| zoom-xaxis | The ptcs-chart-zoom subcomponent for x-axis |
| xaxis | The ptcs-chart-axis subcomponent for x-axis |
| xaxis2 | The ptcs-chart-axis subcomponent for secondary x-axis |
| zoom-yaxis | The ptcs-chart-zoom subcomponent for y-axis |
| yaxis | The ptcs-chart-axis subcomponent for y-axis |
| yaxis2 | The ptcs-chart-axis subcomponent for secondary y-axis |
| action-bar-area | The action bar area container |
| action-bar | The ptcs-chart-action-bar subcomponent |