ptcs-chart
Overview
ptcs-chart is a component ecosystem that enables you to implement data visualization using charts.
The ecosystem consists of three parts:
- Common components: Common tasks that can be used by all components
- Core components: Components that implement the core functionality of a specific chart type - or types
- Compound components: Components that combine common and core components into a single component, for convenient usage
You can use a single compound component, if it meets your requirements, or manually combine common and core components to support more advanced requirements.
The charting ecosystem
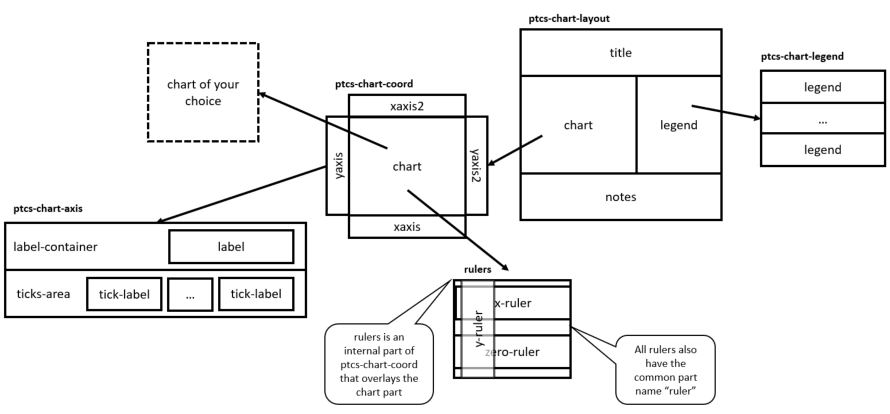
Common components
ptcs-chart-layout, for chart layoutsptcs-chart-legend, for chart legendptcs-chart-coord, for combining a chart with a coordinate system (adds axes and rulers)ptcs-chart-axis, for chart axesptcs-chart-zoom, for chart zooming controls
Core components
ptcs-chart-core-bar, a bar chart componentptcs-chart-core-line, a line chart component, that also implements area charts, scatter plots and streamgraphsptcs-chart-core-pareto, a pareto chart componentptcs-chart-core-schedule, a schedule chart componentptcs-chart-core-waterfall, a waterfall chart component
Compound components
ptcs-chart-bar, a complete bar chart, with a layout, a coordinate system and an x- and y-axisptcs-chart-line, a complete line chart, area chart, scatter plot and streamgraphptcs-chart-pareto, a combination of a line and a bar chart that enables you to perform Pareto analysisptcs-chart-waterfall, a complete waterfall chart to visualize changes to dataptcs-chart-schedule, a complete schedule chart to visualize schedule data