ptcs-chart-layout
Visual
Overview
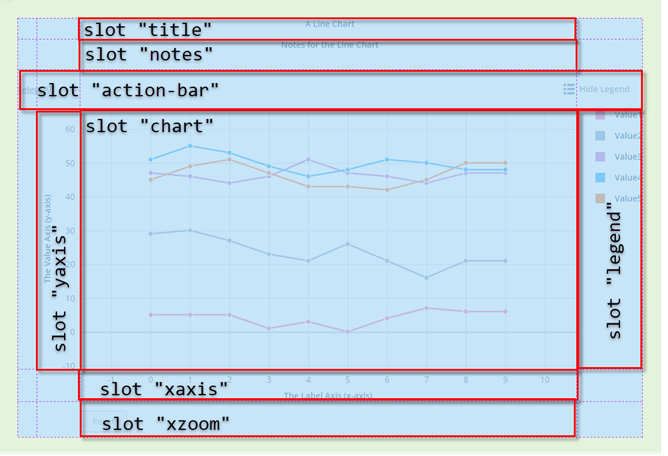
ptcs-chart-layout is a subcomponent for common chart areas (or panes) displayed in a CSS grid that defines the structure in which
charts are displayed. The layout areas consist of the following slots:
chart, the chart areatitle, the chart title areanotes, the chart notes areaaction-bar, the area for theShow / Hide Legendbutton andSelect / Clear Alllinklegend, the legend areaxaxis, the x-axis areaxaxis2, the secondary x-axis areaxzoom, the x-axis zoom controls areayaxis, the y-axis areayaxis2, the secondary y-axis areayzoom, the y-axis zoom controls area
The actual location of the slots within the layout as well as their visibility depends on configuration settings for elements such as title, legend, or notes (i.e. component properties like titlePos, legend-pos, notesPos, sparkView etc). Slots for secondary axes and y-axis zoom controls are not indicated.
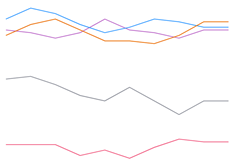
Property sparkView hides all areas except the chart pane, typically used to show a simplified thumbnail view of the graph.
Basic Usage
The example below outlines a subset of the chart layout definition from the line chart, without any secondary axes, and omits some properties
for brevity's sake. Note how the ptcs-chart-layout nests around other chart subcomponents like ptcs-chart-coord and ptcs-chart-legend,
and the repeated use of subcomponents ptcs-chart-zoom and ptcs-chart-axis to provide corresponding chart functionality on both axes.
Review any one of the chart components (ptcs-chart-bar, ptcs-chart-line, etc) for a comprehensive example.
    <ptcs-chart-layout id="chart-layout" style="height:100%" part="chart-layout"
                           disabled="[[disabled]]"
                           title-pos="[[titlePos]]" hide-title="[[!titleLabel]]"
                           notes-pos="[[notesPos]]" notes-align="[[notesAlign]]" hide-notes="[[_hideNotes(notesLabel, hideNotes)]]"
                           legend-pos="[[legendPos]]" hide-legend="[[_hideLegend(hideLegend, legend)]]"
                           eff-legend-pos="{{effLegendPos}}"
                           zoom="[[_zoomActive]]"
                           x-zoom="[[_showZoomX(...)]]"
                           y-zoom="[[_showZoomY(...)]]"
                           flip-axes="[[flipAxes]]"
                           flip-x-axis="[[flipXAxis]]"
                           flip-y-axis="[[flipYAxis]]"
                           spark-view="[[sparkView]]"
                           x-axis="[[!hideXAxis]]"
                           y-axis="[[!hideYAxis]]"
                           is-reference-lines="[[isReferenceLines]]"
                           action-bar="[[...]]">
            <div part="title-area" slot="title">
                <ptcs-label part="title-label" label="[[titleLabel]]" variant="[[titleVariant]]" multi-line></ptcs-label>
            </div>
            <div part="notes-area" slot="notes">
                <ptcs-label part="notes-label" label="[[notesLabel]]" variant="label" multi-line></ptcs-label>
            </div>
            <ptcs-chart-coord slot="chart" part="chart">
             ...
            </ptcs-chart-coord>
            <div part="legend-area" slot="legend">
                <ptcs-chart-legend part="legend"
                  ...
                ></ptcs-chart-legend>
            </div>
            <ptcs-chart-zoom slot="xzoom" part="zoom-xaxis"
              ...
            ></ptcs-chart-zoom>
            <ptcs-chart-axis id="xaxis" slot="xaxis" part="xaxis"
              ...
            ></ptcs-chart-axis>
            <ptcs-chart-zoom slot="yzoom" id="zoomY" part="zoom-yaxis"
              ...
            ></ptcs-chart-zoom>
            <ptcs-chart-axis id="yaxis" slot="yaxis" part="yaxis">
              ...
            </ptcs-chart-axis>
            <div part="action-bar-area" slot="action-bar">
                <ptcs-toolbar part="action-bar"
                  ...
                ></ptcs-toolbar>
            </div>
        </ptcs-chart-layout>
Component API
Since ptcs-chart-layout is a common chart subcomponent many of its properties are familiar chart properties (e.g. titlePos, notesPos, etc), which are normally exposed using the same property name in the charts, while other properties are specific to the component (e.g. effTitlePos, effNotesPos, etc).
Properties
| Property | Type | Description |
|---|---|---|
| titlePos | String | Specifies the title position. Supported values: "top", "bottom", "left", or "right" |
| hideTitle | Boolean | Toggle to hide the title |
| notesPos | String | Specifies the notes position. Supported values: "top", "bottom", "left", or "right" |
| hideNotes | Boolean | Hides the notes area |
| notesAlign | String | Specifies the notes alignment. Supported values: "left", "center", or "right" |
| legendPos | String | Specifies the legend position. Supported values: "top", "bottom", "left", or "right" |
| hideLegend | Boolean | Hide the legend? |
| xAxis | Boolean | Show x-axis area, unless sparkView |
| yAxis | Boolean | Show y-axis area, unless sparkView |
| isReferenceLines | Boolean | Show reference (a.k.a. threshold) lines, unless sparkView |
| zoom | Boolean | Zooming of some kind is enabled, display reset button |
| xZoom | Boolean | Show x-zoom area, unless sparkView |
| yZoom | Boolean | Show y-zoom area, unless sparkView |
| actionBar | String | Specifies the position of the Action Bar area. Supported values: "top", "bottom" |
| flipAxes | Boolean | Flips the positions of the x- and y-axes |
| flipXAxis | Boolean | Flips the x-axis to the opposite side of the chart |
| flipYAxis | Boolean | Flips the y-axis to the opposite side of the chart |
| sparkView | Boolean | Hides all areas except the chart pane |
| narrow | Boolean | Toggle for narrow view, such as on a mobile device |
| effTitlePos | String | The effective title position (dependent on propTitle and hideTitle) |
| effNotesPos | String | The effective notes position |
| effLegendPos | String | The effective legend position |
Styling
Parts
The ptcs-chart-layout parts have a 1:1 correspondence with the slot by same name. The ptcs-label inserted by this component under
the title and notes slots are assigned their parent container's width as maxWidth (parts title-area and notes-area,
respectively).
| Part | Description |
|---|---|
| chart | the chart area |
| title | the chart title area |
| notes | the chart notes area |
| action-bar | the area for the Show / Hide Legend button and Select / Clear All link |
| legend | the legend area |
| xaxis | the x-axis area |
| xaxis2 | the secondary x-axis area |
| xzoom | the x-axis zoom controls area |
| yaxis | the y-axis area |
| yaxis2 | the secondary y-axis area |
| yzoom | the y-axis zoom controls area |
State attributes
| Attribute | Description | Part |
|---|---|---|
| eff-legend-pos | The effective legend position | :host |
| eff-notes-pos | The effective notes position | :host |
| flip-axes | Are the axes flipped? | :host |
| legend-pos | The legend position | :host |
| notes-pos | The notes position | :host |
| title-pos | The title position | :host |