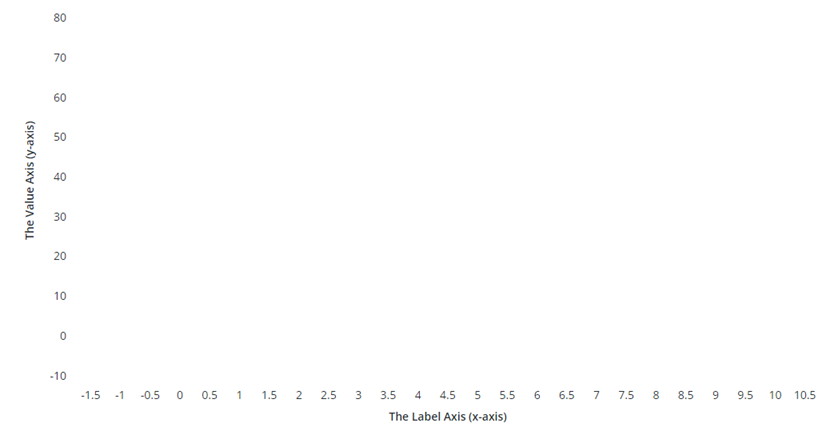
ptcs-chart-axis
Visual

Overview
ptcs-chart-axis is a subcomponent used to add axes to charts (one for each axis). The example listed below outlines declarations
for a chart with four axes: x-axis, secondary x-axis, y-axis, and secondary y-axis. This component is nested within ptcs-chart-layout.
Usage Examples
Basic Usage
        <ptcs-chart-layout
              ...
            <ptcs-chart-axis id="xaxis" slot="xaxis" part="xaxis"
                disabled="[[disabled]]"
                type="[[_xType]]"
                spec-min="[[_specValueMin(specXMin, specXMax, xZoomStart, noXZoom, _xMin, _xMax, _xType)]]"
                spec-max="[[_specValueMax(specXMin, specXMax, xZoomEnd, noXZoom, _xMin, _xMax, _xType)]]"
                side="[[_xSide(flipXAxis, flipAxes)]]"
                label="[[xAxisLabel]]"
                align-label="[[xAxisAlign]]"
                min-value="[[_xMin]]"
                max-value="[[_xMax]]"
                size="[[_xSize(_graphWidth, _graphHeight, flipAxes)]]"
                max-size="[[_if(flipAxes, verticalAxisMaxWidth, horizontalAxisMaxHeight)]]"
                ticks="{{_xTicks}}"
                ticks-rotation="[[horizontalTicksRotation]]"
                reverse="[[reverseXAxis]]"
                scale="{{_xScale}}"
                number-format-specifier="[[xAxisNumberFormatSpecifier]]"
                date-format-token="[[xAxisDateFormatToken]]"
                hidden\$="[[hideXAxis]]"></ptcs-chart-axis>
            <ptcs-chart-axis id="xaxis2" slot="xaxis2" part="xaxis2"
                ...
            ></ptcs-chart-axis>
            <ptcs-chart-axis id="yaxis" slot="yaxis" part="yaxis"
               ...
            ></ptcs-chart-axis>
            <ptcs-chart-axis id="yaxis2" slot="yaxis2" part="yaxis2"
              ...
            ></ptcs-chart-axis>
        </ptcs-chart-layout>
Component API
Properties
| Property |
Type |
Description |
Default |
| type |
Object |
number, date, or array (of labels) |
number |
| side |
String |
Specifies the axis position. Supported values: "top", "bottom", "left", or "right" |
left |
| label |
String |
Axis label |
|
| alignLabel |
String |
Specifies the axis label alignment. Supported values: "start", "center", or "end" |
|
| minValue |
Object |
The minimum value in the data |
|
| maxValue |
Object |
The maximum value in the data |
|
| specMin |
Object |
The specified minimum value in the data: "baseline" | "auto" | value, where "baseline" means to start from zero if the minimum value in the data is non-negative, otherwise use "auto". "auto": Use the minimum value of the data and subtract 20% of the full range of the data. Value: start at specified value. |
|
| specMax |
Object |
The specified maximum value in the data: "auto" | value |
|
| numTicks |
Number |
Set the number of labels on the axis |
|
| size |
Number |
The current size / length of the axis (width or height, depending on property side) |
|
| maxSize |
String |
The maximum size / length of the axis |
|
| reverse |
Boolean |
Reverse the axis direction? |
|
| rotateTicks |
Boolean |
Rotate the ticks on collision? |
false |
| scale |
Function |
The generated scale |
|
| scaleMin |
Number |
Minimum value on current scale: function(minValue, maxValue, minSpec) |
|
| scaleMax |
Number |
Maximum value on current scale: function(minValue, maxValue, maxSpec) |
|
| ticks |
Array |
Axis ticks [{label, value, offs}, ...] |
|
| dualTicks |
Array |
Ticks from a dual axis that this axis should synchronize to |
|
| ticksRotation |
String |
Only for horizontal axes: Set explicit ticks rotation in degrees, instead of using auto rotation. The allowed range is: -180 to 180. If this property is not specified, horizontal axis ticks auto-rotate 90 degrees if they collide when not rotated. |
|
| outerPadding |
String |
Padding before and after the chart area |
|
| innerPadding |
String |
Inner padding, between data in different groups |
|
| numberFormat |
String |
Number format specifier, has precedence over numberFormatSpecifier |
|
| numberFormatSpecifier |
String |
The number format (e.g. 0000.0, #% or 0.00) to use on the axis |
|
| dateFormatToken |
String |
The date format token (e.g. 'YYYY-MM-DD') |
|
| referenceLines |
Array |
Array of threshold line ticks |
|
| isReferenceLines |
Boolean |
Does the axis have threshold lines? |
|
Styling
Parts
| Part |
Description |
| label-container |
Container for the axis label |
| label |
Axis label |
| ticks-area |
Container for the axis ticks |
State attributes
| Attribute |
Description |
Part |
| side |
Axis location (left / right / top / bottom) |
:host |
| align-label |
Label alignment (left / center / right) |
:host |
| rotate-ticks |
Rotate ticks on collision? |
:host |
| is-reference-lines |
Does the axis have threshold lines? |
:host |
