ptcs-chart-coord
Visual

Overview
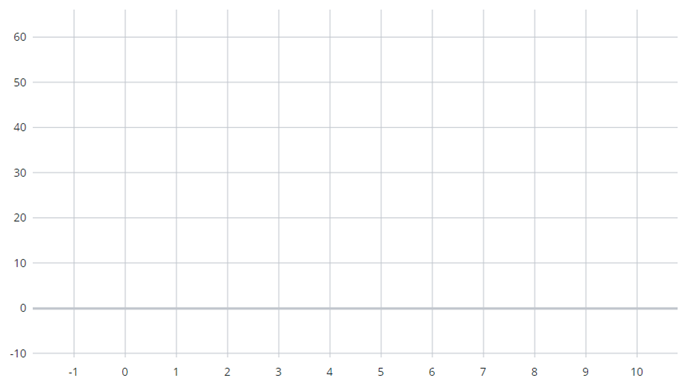
ptcs-chart-coord is a chart subcomponent to combine a chart with a coordinate system, adding axes and rules (lines) that overlay the chart,
aligned with the ticks of the respective axes.
Basic Usage
        <ptcs-chart-layout
              ...
            <ptcs-chart-coord slot="chart" part="chart"
                flip-axes="[[flipAxes]]"
                flip-x-axis="[[flipXAxis]]"
                flip-y-axis="[[flipYAxis]]"
                x-ticks="[[_xTicks]]"
                y-ticks="[[_yTicks]]"
                x2-ticks="[[_xReferenceLines]]"
                y2-ticks="[[_if(isReferenceLines, _yReferenceLines, _y2Ticks)]]"
                show-x-rulers="[[showXRulers]]"
                show-x2-rulers="[[isReferenceLines]]"
                has-y2="[[_hasY2(showY2Axis, data2.*)]]"
                show-y-rulers="[[_showYRulers(...)]]"
                show-y2-rulers="[[_showY2Rulers(...)]]"
                is-reference-lines="[[isReferenceLines]]"
                y-axis-ruler-alignment="[[yAxisRulerAlignment]]"
                front-rulers="[[frontRulers]]"
                hide-zero-ruler="[[hideZeroRuler]]"
                spark-view="[[sparkView]]"
                graph-width="{{_graphWidth}}"
                graph-height="{{_graphHeight}}">
                <ptcs-chart-core-graph part="core-chart"
                  ...
                ></ptcs-chart-core-graph>
            </ptcs-chart-coord>
        </ptcs-chart-layout>
The ptcs-chart-coord is nested within ptcs-chart-layout and contains a subcomponent for the targeted chart type's core features.
Component API
Properties
| Property | Type | Description |
|---|---|---|
| flipXAxis | Boolean | Swap x-axis and secondary x-axis? |
| flipYAxis | Boolean | Swap y-axis and secondary y-axis? |
| flipAxes | Boolean | Flip axes (change place of x-axes and y-axes) |
| hideZeroRuler | Boolean | Hide the highlighted line through the origin of the coordinate system? |
| showXRulers | Boolean | Show lines grid of the x-axis? |
| showX2Rulers | Boolean | Show lines grid of the secondary x-axis? |
| frontRulers | Boolean | Show the grid lines on top of the graph? |
| xTicks | Array | Ticks (line markings) array for the x-axis |
| x2Ticks | Array | Ticks (line markings) array for the secondary x-axis |
| showYRulers | Boolean | Show lines grid of the x-axis? |
| showY2Rulers | Boolean | Show lines grid of the secondary y-axis? |
| yTicks | Array | Ticks (line markings) array for the y-axis |
| y2Ticks | Array | Ticks (line markings) array for the secondary y-axis |
| isReferenceLines | Boolean | Show threshold lines? |
| graphWidth | Number | Width of the graph |
| graphHeight | Number | Height of the graph |
| sparkView | Boolean | Hide the graph lines grid? |
| yAxisRulerAlignment | String | Alignment for the y-axis |
| hasY2 | Boolean | Graph has secondary y-axis? |
Styling
Parts
| Part | Description |
|---|---|
| xaxis-slot | The slot for the x-axis |
| yaxis-slot | The slot for y-axis |
| xaxis2-slot | The slot for the secondary x-axis |
| yaxis2-slot | The slot for the secondary y-axis |
| rulers | Container for the graph horizontal and vertical lines |
| chart-slot | The slot for the chart |
State attributes
| Attribute | Description | Part |
|---|---|---|
| flip-x-axis | Swap x-axis and secondary x-axis? | :host |
| flip-y-axis | Swap y-axis and secondary y-axis? | :host |
| flip-axes | Change place on x-axes and y-axes? | :host |
| hide-zero-ruler | Hide the line through the origin of the coordinate system? | :host |
| show-x-rulers | Show lines grid of the x-axis? | :host |
| show-x-2-rulers | Show lines grid of the secondary x-axis? | :host |
| front-rulers | Show lines grid on top of the graph? | :host |
| show-y-rulers | Show lines grid of the y-axis? | :host |
| show-y-2-rulers | Show lines grid of the secondary y-axis? | :host |
| is-reference-lines | Show threshold lines? | :host |