ptcs-chart-core-pie
Visual
Overview
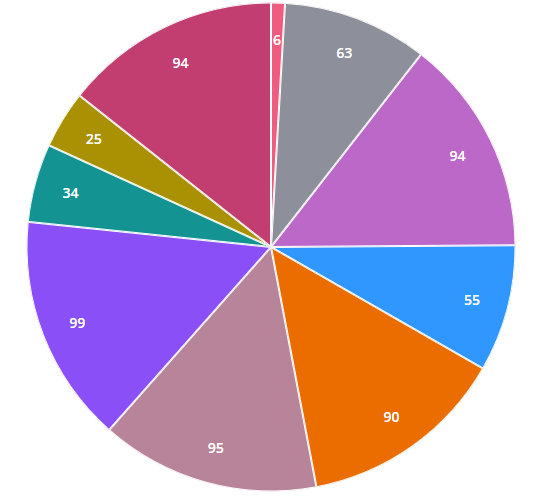
ptcs-chart-core-pie is a core component that enables you to visualize data as slices within a pie chart.
Usage Example
                <ptcs-chart-core-pie id="chart" slot="chart" part="core-chart"
                tabindex\$="[[_delegatedFocus]]"
                data="[[_data]]"
                value-format-specifier="[[valueFormatSpecifier]]"
                legend="[[_legend]]"
                tooltip-template="[[tooltipTemplate]]"
                filter-legend="[[_selectedLegend]]"
                donut="[[donut]]"
                polar="[[polar]]"
                pad-angle="[[padAngle]]"
                start-angle="[[startAngle]]"
                end-angle="[[endAngle]]"
                corner-radius="[[cornerRadius]]"
                highlight-selection="[[highlightSelection]]"
                show-values="[[_showValues(sparkView, showValues)]]"
                value-pos="[[valuePos]]"
                percent-label="[[percentLabel]]"
                inside-label-show-hide="[[insideLabelShowHide]]"
                single-inside-value-label-type="[[singleInsideValueLabelType]]"
                selection-mode="[[selectionMode]]"
                on-chart-selection="_onSelectionChanged"
                chart-state-data-error="{{_chartStateDataError}}"
                chart-state-data-empty="{{_chartStateDataEmpty}}"></ptcs-chart-core-pie>
Component API
Properties
| Property |
Type |
Description |
| data |
Array |
data = [{label, data}, ...] where data is value |
| disabled |
Boolean |
Is the pie chart disabled? |
| valueFormatSpecifier |
String |
Format for slices values |
| legend |
Array |
An array of strings that specify the legend names |
| filterLegend |
Array |
An array of strings that contains the selected legend names within the ptcs-legend component |
| donut |
Number |
Sets the size of the hole in the center of the pie chart. Use this property to display a donut chart. Supported values are between 0 and 0.99 |
| polar |
Boolean |
Uses the radius to visualize the difference between values. Each category is displayed at an equal angle |
| padAngle |
Number |
Sets the size of the padding between the pie chart slices |
| startAngle |
Number |
Sets the start angle for the chart |
| endAngle |
Number |
Sets the end angle for the chart |
| cornerRadius |
Number |
Specifies the corner radius for the chart slices |
| highlightSelection |
Boolean |
When enabled, the selected slices are pushed out and offset from the main chart |
| showValues |
String |
Shows the value of each slice. Supported values: "none", "inside", "outside" |
| valuePos |
String |
Sets the position of the data labels relative to the slices. Supported values: marker, in, out or out with line |
| percentLabel |
Boolean |
Converts and displays the data values as percentages |
| insideLabelShowHide |
Boolean |
Shows a data label next to a donut chart slice when it is in a selected, hover, or focus state |
| singleInsideValueLabelType |
String |
The variant assigned to the inside Value Label ptcs-label |
| tooltipTemplate |
String |
Custom tooltip to display when a data point on the chart is selected. You can show a title, text, data values, and create new lines. Use the following syntax: Add #title# before a string to show a title, #newline# to create a new line, ${} to display data from available pie chart tokens: ${label}, ${value}). |
| selectionMode |
String |
Set selection mode: "none" (default) - no slices can be selected. "single" - one slice can be selected. "multiple" - any number of slices can be selected |
Events
| Name |
Data |
Description |
| series-click |
no data |
|
| selected-data-changed |
selection |
Chart selection |
Styling
Parts
| Part |
Description |
| chart |
The pie chart |
| pie |
The pie slice |
| lines |
The value lines |
| value |
The pie chart slice value |
State attributes
| Attribute |
Description |
Part |
| disabled |
Is the Pie Chart disabled? |
:host |