| disabled |
Boolean |
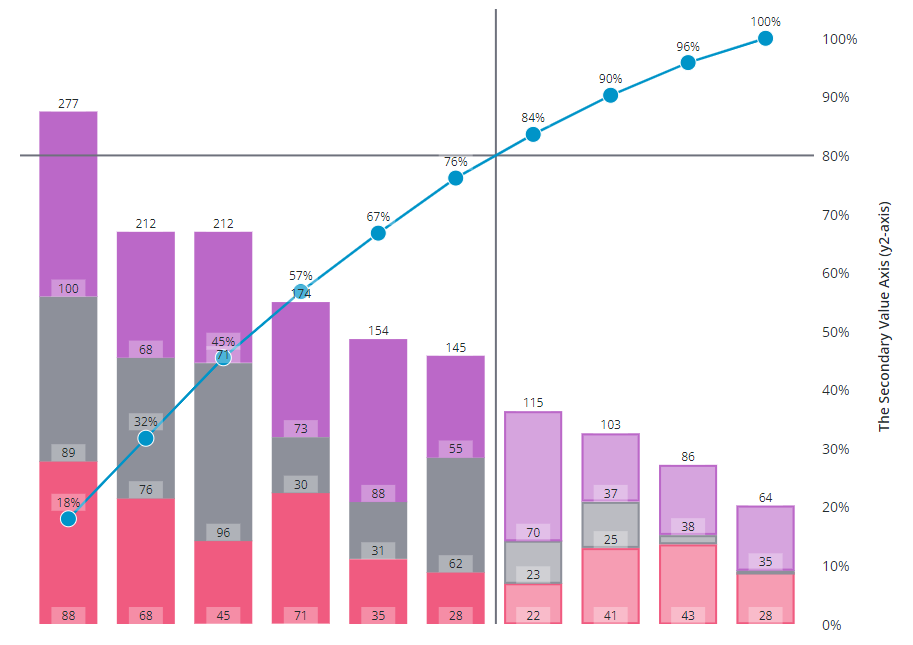
Disables the Pareto chart |
| thresholdValue |
Number |
The percentage threshold value for the Pareto analysis |
| thresholdLine |
String |
The orientation of the threshold line ('horizontal', 'vertical', 'both', or 'none') |
| emphasizeThresholdFactors |
Boolean |
Applies a different style to the categories that are outside the defined threshold value. |
| hideCumulativePercentage |
Boolean |
Hides the cumulative percentage line |
| data |
Array |
The chart data |
| legend |
Array |
Array of strings that specifies the legend names, for tooltip |
| filterLegend |
Array |
Index of selected legends |
| stackOrder |
String |
Controls the data stacking order: 'auto', 'reverse', 'appearance', 'ascending', 'descending', or 'insideout' |
| xType |
Object |
Generated: x-values sorted according to percentage |
| xMin |
Object |
Minimum x value in data |
| xMax |
Object |
Maximum x value in data |
| yMin |
Object |
Minimum y value in data |
| yMax |
Object |
Maximum y value in data |
| yValueFormat |
String |
The number format to use on the y-axis |
| xScale |
Function |
Scale that maps x-positions to x-axis |
| yScale |
Function |
Scale that maps y-positions to y-axis |
| flipAxes |
Boolean |
Swap the position of the x- and y-axes? |
| reverseXAxis |
Boolean |
Reverse the x-axis direction? |
| reverseYAxis |
Boolean |
Reverse the y-axis direction? |
| showValues |
String |
Shows the value of each bar. Supported values: "none", "inside", "outside", "inside-end" |
| curve |
String |
Specify the curve drawing method. Supported values: "linear", "basis", "bundle", "cardinal", "catmull-rom", "monotone-x", "monotone-y", "natural", "step" |
| bundleBeta |
Number |
Parameter with value between 0 .. 1 when curve = "bundle" |
| cardinalTension |
Number |
Parameter with value between 0 .. 1 when curve = "cardinal" |
| catmullRomAlpha |
Number |
Parameter with value between 0 .. 1 when curve = "catmull-rom" |
| stepPosition |
String |
Parameter when curve = "step". Supported values: "center", "before", "after" |
| marker |
String |
Specify the marker shape. Supported values: "none", "square", "circle", "triangle", "plus", "cross" |
| markerSize |
String or Number |
Specify the marker size. Supported values: "small", "medium", "large", "xlarge", number (pixels) |
| showMarkerValues |
String |
Show marker values. The values are displayed relative to the marker position. Supported values: "no", "above", "on","below" |
| markerValueFormat |
String |
The number format for tick labels |
| zoomSelect |
Boolean |
Zoom by selecting two elements |
| zoomDragX |
Boolean |
Zoom x-axis by click-dragging the mouse over the chart |
| zoomDragY |
Boolean |
Zoom y-axis by click-dragging the mouse over the chart |
| showY2Axis |
Boolean |
Show secondary y-axis |
| y2Min |
Object |
Minimum y2 value (should be 0) |
| y2Max |
Object |
Maximum y2 value (should be 100) |
| y2Scale |
Function |
Scale that maps y2-positions (the percentage value) to y2-axis |
| selectionMode |
String |
Set selection mode: "none" (default) - no markers can be selected. "single" - one marker can be selected. "multiple" - any number of markers can be selected. |
| unselectable |
Array |
Array of indexes, where data[index] is unselectable |
| labelUnits |
String |
Unit for labels (default: empty string) |
| labelOfTotal |
String |
Default value: 'of total' |
| labelCumulativeValue |
String |
Default value: 'Cumulative value' |
| tooltipTemplate |
String |
Custom tooltip to display when a data point is selected on the chart. You can show a title, text, data values, and create new lines. Use the following syntax: Add #title# before a string to show a title, #newline# to create a new line, ${} to display data from available bar chart tokens: ${label}, ${series}, ${value}). |
| tooltipTemplate2 |
String |
Custom tooltip to display when a secondary axis marker is selected on the chart. You can show a title, text, data values, and create new lines. Use the following syntax: Add #title# before a string to show a title, #newline# to create a new line, ${} to display data from available pareto chart tokens for markers: ${label}, ${total}, ${perc}, ${percCum}}. |