ptcs-chart-core-line
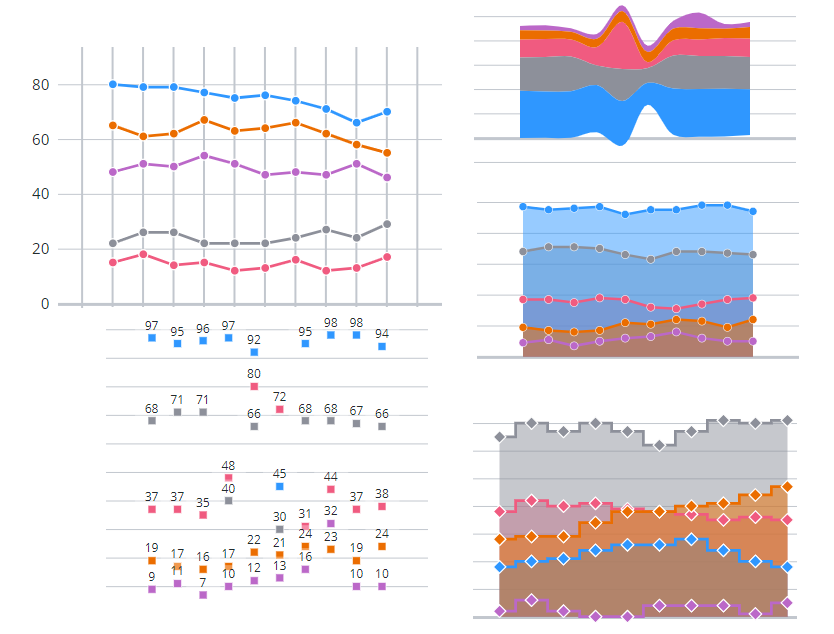
Visual
Overview
ptcs-chart-core-line is a slotted core component that enables you to visualize data as a line chart.
The line chart can display:
- lines
- areas between the line and the zero axis
- value markers, such as circles, squares, triangles, and more
- values, that are placed relative to the value marker (above, below, or on top of it)
When the chart displays several series, you can display values as independent lines, areas, or stacked. Stacked values support multiple options.
The X and Y-axis values can be numbers, string labels, or dates (i.e. JavaScript Date objects).
You can configure the line chart properties to display one of the following chart types:
- Area chart
- Line chart
- Scatter plot
- Step chart
- Streamgraph
- Time Series chart
Usage Example
Basic Usage
        <ptcs-chart-core-line id="chart" slot="chart" part="core-chart" style="pointer-events: auto"
            disabled="[[disabled]]"
            data="[[data]]"
            legend="[[legend]]"
            tooltip-template="[[tooltipTemplate]]"
            stack-method="[[stackMethod]]"
            stack-order="[[stackOrder]]"
            stack-method2="[[stackMethod2]]"
            stack-order2="[[stackOrder2]]"
            x-type="[[_xType]]"
            x-min="{{_xMin}}"
            x-max="{{_xMax}}"
            y-type="[[yType]]"
            y-min="{{_yMin}}"
            y-max="{{_yMax}}"
            hide-lines="[[hideLines]]"
            show-areas="[[showAreas]]"
            curve="[[_getCurve(chartType, curve)]]"
            bundle-beta="[[bundleBeta]]"
            cardinal-tension="[[cardinalTension]]"
            catmull-rom-alpha="[[catmullRomAlpha]]"
            step-position="[[stepPosition]]"
            flip-axes="[[flipAxes]]"
            reverse-x-axis="[[reverseXAxis]]"
            reverse-y-axis="[[reverseYAxis]]"
            x-scale="[[_xScale]]"
            y-scale="[[_yScale]]"
            filter-legend="[[_selectedLegend]]"
            marker="[[_getMarker(sparkView, chartType, hideMarkers, marker)]]"
            marker-size="[[markerSize]]"
            show-values="[[_showValues(sparkView, hideValues, showValues)]]"
            show-y2-axis="[[showY2Axis]]"
            data2="[[data2]]"
            y2-type="[[y2Type]]"
            y2-min="{{_y2Min}}"
            y2-max="{{_y2Max}}"
            y2-scale="[[_y2Scale]]"
            cursor-type="[[_cursorType(pointerType, flipAxes)]]"
            cursor-target="[[_cursorTarget(dataPointSelection, flipAxes)]]"
            zoom-select="[[_zoomSelect(xZoomSelect, noXZoom, yZoomSelect, noYZoom)]]"
            zoom-drag-x="[[_zoomDrag(xZoomDrag, noXZoom)]]"
            zoom-drag-y="[[_zoomDrag(yZoomDrag, noYZoom)]]"
            selection-mode="[[selectionMode]]"
            on-chart-selection="_onSelectionChanged"
            on-zoom-selection="_onZoomSelection"></ptcs-chart-core-line>
Component API
Properties
| Property | Type | Description |
|---|---|---|
| data | Array | The chart data |
| disabled | Boolean | Is the line chart disabled? |
| legend | Array | Array of strings for tooltip legend data |
| stackMethod | String | Stack method. If assigned, enables stacking. Supported values: "auto", "expand", "diverging", "silhouette", "wiggle" |
| stackOrder | String | Specifies the stacking order. Supported values: "auto", "reverse", "appearance", "ascending", "descending", "insideout" |
| stacked | Boolean | Is stacking enabled? |
| stacked2 | Boolean | Is stacking enabled for secondary y-axis? |
| xType | String | Specifies the type of the x-values. Supported values: "number", "date", "string" |
| yType | String | Specifies the type of the y-values. Supported values: "number", "date", "string" |
| xMin | Object | Minimum x value in data |
| xMax | Object | Maximum x value in data |
| yMin | Object | Minimum y value in data |
| yMax | Object | Maximum y value in data |
| xScale | Function | Scale that maps x-positions to x-axis |
| yScale | Function | Scale that maps y-positions to y-axis |
| flipAxes | Boolean | Flip the positions of the x- and y-axes |
| filterLegend | Boolean | When true, each legend item has a checkbox that allows the user to hide or show the corresponding data |
| hideLines | Boolean | Hide the chart lines |
| showAreas | Boolean | Show areas under chart lines? |
| curve | String | Specify the curve drawing method. Supported values: "linear", "basis", "bundle", "cardinal", "catmull-rom", "monotone-x", "monotone-y", "natural", "step" |
| bundleBeta | Number | Parameter with value between 0 .. 1 when curve = "bundle" |
| cardinalTension | Number | Parameter with value between 0 .. 1 when curve = "cardinal" |
| catmullRomAlpha | Number | Parameter with value between 0 .. 1 when curve = "catmull-rom" |
| stepPosition | String | Parameter when curve = "step". Supported values: "center", "before", "after" |
| marker | String | Specify the marker shape. Supported values: "none", "square", "circle", "triangle", "plus", "cross" |
| markerSize | String or Number | Specify the marker size. Supported values: "small", "medium", "large", "xlarge", number (pixels) |
| showValues | String | Show marker values. The values are displayed relative to the marker position. Supported values: "above", "on","below" |
| zoomSelect | Boolean | Zoom by selecting two elements |
| zoomDragX | Boolean | Zoom x-axis by click-dragging the mouse over the chart |
| zoomDragY | Boolean | Zoom y-axis by click-dragging the mouse over the chart |
| cursorType | String | Cursor: "auto" (just mouse) || "x" (x-line) || "y" (y-line) || "xy" (cross) |
| cursorTarget | String | Target method: "auto" (over) || "x" (closest x) || "y" (closest y) || "xy" (closest) |
| hoverPick | Object | Index to hovered item in picklist (if any) from cursorType / cursorTarget selection |
| showY2Axis | Boolean | Adds secondary y-axis |
| displayY2 | Boolean | Show secondary y-axis |
| data2 | Array | The chart data attached to the secondary y-axis |
| y2Type | Object | Specifies the type of the values displayed on the secondary y-axis. Supported values: "number", "date", "string" |
| y2Min | Object | Minimum y value in data2 |
| y2Max | Object | Maximum y value in data2 |
| y2Scale | Function | Scale that maps y2-positions to secondary y-axis |
| stackMethod2 | String | Stack method for secondary axis. If assigned, enables stacking. Supported values: "auto", "expand", "diverging", "silhouette", "wiggle" |
| stackOrder2 | String | Specifies the stacking order for secondary axis. Supported values: "auto", "reverse", "appearance", "ascending", "descending", "insideout" |
| selectedData | Object | Selected markers |
| selectionMode | String | Set selection mode: "none" (default) - no markers can be selected. "single" - one marker can be selected. "multiple" - any number of markers can be selected. |
| tooltipTemplate | String | Custom tooltip to display when a data point on the chart is selected. You can show a title, text, data values, and create new lines. Use the following syntax: Add #title# before a string to show a title, #newline# to create a new line, ${ |
| hidenstack | Boolean | Show / hide chart regions |
| hidestack1 | Boolean | Show / hide chart regions for data associated with primary axis |
| hidestack2 | Boolean | Show / hide chart regions for data associated with secondary axis |
Events
| Name | Data | Description |
|---|---|---|
| series-click | Marker X value + Y Value | Click on a marker shape |
| series-click | Array of marker X value + Y Value | Click on an area of a series |
| zoom-selection | detail: {x: left, y: top, w: right - left, h: bottom - top} |
Selected area |
| chart-selection | selection | Selected data |
Styling
Parts
| Part | Description |
|---|---|
| line | The line chart line |
| area | The line chart area |
| marker | The line chart marker |
| value | The line chart marker value |
| dragrect | The zoom drag rectangle |
| selected | The selected chart line |
| focus | Focus marker |
| hover-line | Horizontal / vertical line(s) indicating cursor position while hovering |
State attributes
| Attribute | Description | Part |
|---|---|---|
| disabled | Is the Line Chart disabled? | :host |
| stacked | Is stacking enabled on y-axis? | :host |
| stacked2 | Is stacking enabled on secondary y-axis? | :host |
| hide-lines | Hide lines between markers? | :host |
| show-areas | Show areas beneath each line? | :host |
| marker | Marker shape ("none", "square", "circle", "triangle", "plus", "cross") | :host |
| hover-pick | Index to hovered item | :host |
| display-y2 | Show secondary y-axis? | :host |