ptcs-chart-core-bar
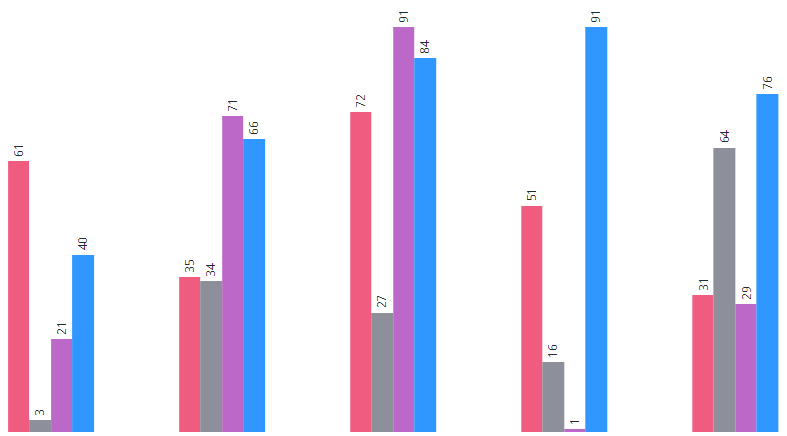
Visual
Overview
ptcs-chart-core-bar is a slotted core component that enables you to visualize data as a bar chart as well as to navigate or select bars via the keyboard.
Usage Example
                <ptcs-chart-core-bar slot="chart" id="chart"  part="core-chart" style="pointer-events: auto"
                    tabindex\$="[[_delegatedFocus]]"
                    data="[[data]]"
                    disabled="[[disabled]]"
                    legend="[[legend]]"
                    tooltip-template="[[tooltipTemplate]]"
                    stack-method="[[stackMethod]]"
                    stack-order="[[stackOrder]]"
                    stack-method2="[[stackMethod2]]"
                    x-min="{{_xMin}}"
                    x-max="{{_xMax}}"
                    y-min="{{_yMin}}"
                    y-max="{{_yMax}}"
                    y-axis-number-format="{{_yAxisNumberFormat}}"
                    show-y2-axis="[[showY2Axis]]"
                    data2="[[data2]]"
                    y2-min="{{_y2Min}}"
                    y2-max="{{_y2Max}}"
                    y2-scale="[[_y2Scale]]"
                    y2-axis-number-format="{{_y2AxisNumberFormat}}"
                    flip-axes="[[flipAxes]]"
                    reverse-x-axis="[[reverseXAxis]]"
                    reverse-y-axis="[[reverseYAxis]]"
                    reverse-y2-axis="[[reverseY2Axis]]"
                    x-scale="[[_xScale]]"
                    y-scale="[[_yScale]]"
                    filter-legend="[[_selectedLegend]]"
                    show-values="[[_showValues(sparkView, hideValues, showValues)]]"
                    show-y2-axis="[[_showY2Axis(showY2Axis, isReferenceLines)]]"
                    group-padding="[[groupPadding]]"
                    zoom-select="[[_zoomSelect(xZoomSelect, noXZoom, yZoomSelect, noYZoom)]]"
                    zoom-drag-x="[[_zoomDrag(xZoomDrag, noXZoom)]]"
                    zoom-drag-y="[[_zoomDrag(yZoomDrag, noYZoom)]]"
                    selection-mode="[[selectionMode]]"
                    on-chart-selection="_onSelectionChanged"
                    on-zoom-selection="_onZoomSelection"></ptcs-chart-core-bar>
Component API
Properties
| Property | Type | Description |
|---|---|---|
| data | Array | data = [{label, data}, ...] where data is value \|\| [value \|\| [start-value, end-value], ...] |
| legend | Array | Array of strings that specifies the legend names |
| disabled | Boolean | Is the bar chart disabled? |
| xMin | Number | Minimum x value in data |
| xMax | Number | Maximum x value in data |
| yMin | Number | Minimum y value in data |
| yMax | Number | Maximum y value in data |
| xScale | Function | Scale that maps x-positions to x-axis |
| yScale | Function | Scale that maps y-positions to y-axis |
| flipAxes | Boolean | Swap the position of the x- and y-axes? |
| stackMethod | Object | Stack method. Only used when each x-value has several y-values. Supported values: falsy, "none", "auto", "expand" |
| showValues | String | Shows the value of each bar. Supported values: "none", "inside", "outside", "inside-end" |
| show | String | Value computed from showValues |
| hideValues | Boolean | Toggle to hide bar values |
| rotateValues | Boolean | Toggle to rotate bar values in order to fit the value within the bar (default: false) |
| reverseXAxis | Boolean | Reverse the x-axis direction? |
| reverseYAxis | Boolean | Reverse the y-axis direction? |
| reverseY2Axis | Boolean | Reverse the secondary y-axis direction? |
| filterLegend | Array | Array to hide or show the corresponding legend |
| groupPadding | String | Padding, in percentage of bar width, between bars that belong to the same group |
| zoomSelect | Boolean | Zoom by selecting two elements? |
| zoomDragX | Boolean | Zoom x-axis by click-dragging the mouse over the chart? |
| zoomDragY | Boolean | Zoom y-axis by click-dragging the mouse over the chart? |
| showY2Axis | Boolean | Display the secondary y-axis? |
| data2 | Array | Secondary y-axis data |
| y2Min | Object | Minimum y value in data2 |
| y2Max | Object | Maximum y value in data2 |
| y2Scale | Function | Scale that maps y2-positions to y2-axis |
| stackMethod2 | Object | Stack bars? Supported values: falsy, "none", "auto", "expand" |
| selectionMode | String | Set selection mode: "none" (default) - no bars can be selected. "single" - one bar can be selected. "multiple" - any number of bars can be selected |
| yAxisNumberFormat | String | The number format to use on the y-axis (e.g. '0.00') |
| y2AxisNumberFormat | String | The number format to use on the secondary y-axis (e.g. '0.00') |
| tooltipTemplate | String | Custom tooltip to display when a data point on the chart is selected. You can show a title, text, data values, and create new lines. Use the following syntax: Add #title# before a string to show a title, #newline# to create a new line, ${ |
Events
| Name | Data | Description |
|---|---|---|
| series-click | (serieIx, valueIx, x, y) | Bar data |
| zoom-selection | detail: {x: left, y: top, w: right - left, h: bottom - top} |
Selected area |
| chart-selection | selection | Chart selection |
Styling
Parts
| Part | Description |
|---|---|
| bar | The bar chart bar |
| drag-rect | The zoom drag rectangle |
| value | The bar chart value |
| value-pos | The bar chart value position |
State attributes
| Attribute | Description | Part |
|---|---|---|
| disabled | Is the Bar Chart disabled? | :host |
| flip-axes | Swap the positions of the x and y axes? | :host |
| stack-method | Bar stacking method | :host |
| show | Show values for each bar? | :host |
| hide-values | Hide bar values? | :host |
| rotate-values | Rotate bar values? | :host |
| reverse-x-axis | Reverse the x-axis? | :host |
| reverse-y-axis | Reverse the y-axis? | :host |
| reverse-y2-axis | Reverse the secondary y-axis? | :host |
| show-y2-axis | Show secondary y-axis? | :host |
| stack-method2 | Bar stacking method for secondary axis | :host |