Production Dashboard
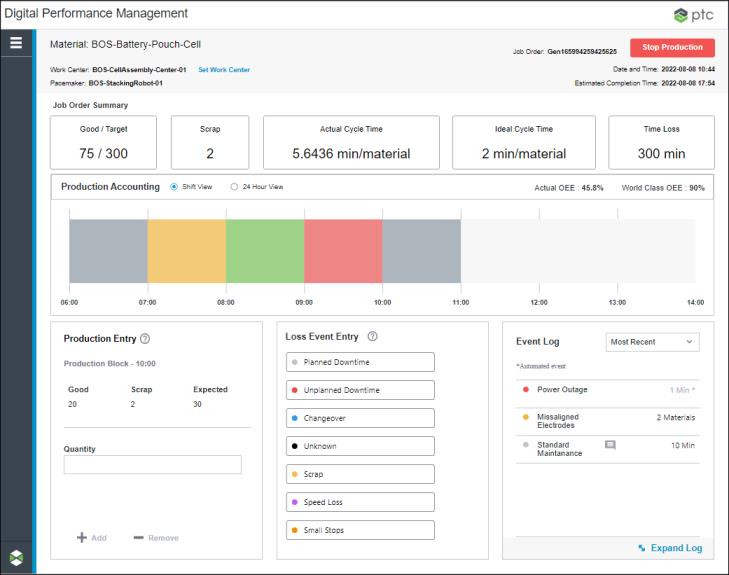
The Production Dashboard is an interface for the operator who is working on a job order within a work center to enter production data for the job order. From the Production Dashboard, the operator enters production counts for material they have produced as well as any events that result in lost production time. The granular data collected through Production Dashboard is presented and analyzed in Performance Analysis and monitored in Action Tracker.
The Production Dashboard supports both manual event entry by operators and automated event entry. Automated event entry is supported when data automation has been configured.
You can access this tool by selecting Production Dashboard from the navigation menu on the left.

The Production Dashboard is made up of multiple parts, which are discussed in the following sections.
Identity Pane
The identity pane contains information about the work center on which you are working.

When the work center has been set, the identity pane displays information about the work center, including the current date and time in the time zone for the site to which the work center belongs, and the pacemaker for the work center. All production counts and loss events that are entered, and all metrics that are shown in the Production Dashboard are in the context of the pacemaker. If a job order is currently in production, the identity pane displays material that is being produced, the ID of the current job order, and the estimated completion time of the job order.
The estimated completion time is calculated by adding the remaining time left on the job order to the current time. The remaining time is calculated by multiplying the remaining material to be produced (the target count minus the good count) by the ideal cycle time for the material on the current work center. The estimated completion time is recalculated whenever the work center is changed, a production block completes, the production count changes, the scrap count changes, or a loss event is entered or deleted.
Job Order Summary Pane
The Job Order Summary pane provides information about the current job order.

The following information is displayed:
• Good / Target—The current number of good units that have been produced for the job order compared to the target number of units needed to complete the job order.
• Scrap—The total number of units that have been scrapped for the job order.
• Actual Cycle Time—The calculated actual cycle time for the job order. The actual cycle time is the time it takes to produce one unit of material. This value is calculated as the production time for all completed and running production blocks divided by the total produced quantity (the good count plus the scrap count) for all completed and running production blocks. The actual cycle time is recalculated each time production count is entered, a loss event is added, or an automated event is received. Refreshing the Production Dashboard also updates the actual cycle time.
• Ideal Cycle Time—The ideal time to produce one unit of this material on the current work center. This is uniquely configured for each material produced by a work center.
• Time Loss—The total time loss for the job order, calculated as the good count multiplied by the ideal cycle time for the material, subtracted from the duration of all completed production blocks for the job order. This value is recalculated at the end of each production block.
If data automation is set up, the Connection field displays at the top right of this pane, indicating whether the pacemaker is currently connected or disconnected. The Last Updated field displays when the Production Dashboard was last updated after receiving an automated event.
Production Accounting Pane
The Production Accounting pane provides a visual display of the production blocks for the current work center, allowing you to account for losses that occurred in completed production blocks for the current shift or for the past 24 hours. Clicking on a completed production block in the chart launches the Time Loss Accounting window for that production block.

There are two views for the Production Accounting pane. In the 24 Hour View, the production blocks for the past 24 hours display. In Shift View, if you are in a scheduled shift, the production blocks for the current shift display. If you are outside of a scheduled shift, then the production blocks displayed are for a rolling window of time. This rolling time window defaults to 8 hours, but can be configured. For more information, see Configurations (Production Dashboard Building Block). If the pacemaker for the work center has been changed, only production blocks for the current pacemaker display.
The Actual OEE (overall equipment effectiveness) value for the work center is calculated based on the time frame shown in the current view. The World Class OEE value is displayed for comparison.
The color of each production block in the chart is determined by the production block’s OEE and the OEE threshold values that are configured for the site to which the current work center belongs. Green indicates a percentage in the good range, yellow indicates a percentage in the OK range, and red represents a percentage in the poor range.
If there is time loss for a completed production block that still needs to be accounted for, that production block is colored grey. Complete the time loss accounting for grey production blocks so that their OEE can be calculated. The current production block is also colored grey, as time loss accounting cannot be completed until the production block itself is complete. |
Hover over a production block in the chart to view a tooltip with information for the production block:
• The material produced during the production block.
• The start time and end time of the production block.
• The good production count compared to the expected production count for the production block. The expected production count is calculated as the production block duration divided by the ideal cycle time for the material being produced.
• The ID for the job order being produced during the production block. If no job order was in production during the production block, then N/A displays.
For more information, see Production Blocks.
Quick Entry and Viewing Panes for the Current Production Block
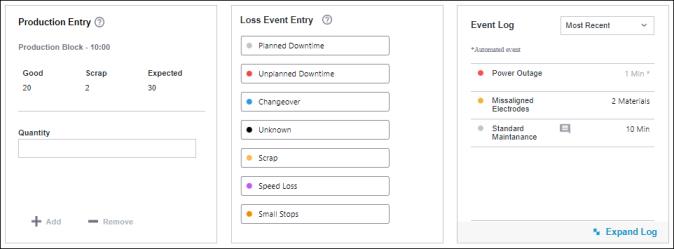
When a job order is in production, the three panes at the bottom of the Production Dashboard provide operators with quick data entry and viewing options for the current production block.

In the Production Entry pane, you can enter production count for the current production block as material is produced. The Good and Scrap counts that are shown are cumulative for the production block. Production count entered here increases the Good count. The Scrap count updates when scrap loss events are entered. The Expected value is the expected production count for the current production block. This value is calculated as the production block duration divided by the ideal cycle time for the material being produced.
The Loss Event Entry pane is where you can enter loss events during the production block. Select a loss category to begin entering a loss event.
In the Event Log pane you can view the most recent loss events for the current production block. Click on an event in the list to edit the event. To see events outside of the current production block, click Expand Log. For more information, see Using the Event Log.