Action Tracker
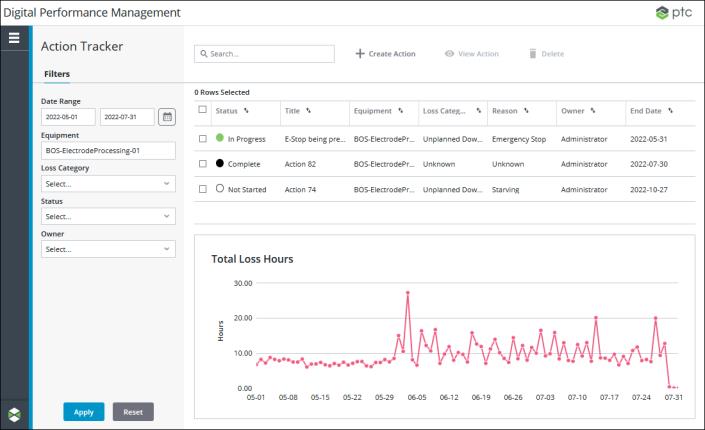
Action Tracker is a data-driven continuous improvement tool that visualizes the impact of improvement efforts in real time. In Action Tracker, you can monitor time loss improvements, providing transparency into improvement initiatives and confirming value delivered. Use the root causes for production loss that you have identified in Performance Analysis to create actions for improvement initiatives.
You can access this tool by selecting Action Tracker from the navigation menu on the left.

From the main Action Tracker page, you can:
• View the list of actions present in the system. The list is initially sorted by the date when the actions were created, with the most recent on top. You can sort the actions list on any column.
• Apply filters to narrow down the list of actions.
• Search for actions in the list by entering search strings in the Search field. This searches the currently filtered list of actions, and can be used to further refine the list.
• Delete actions by selecting one or more actions in the list, and clicking Delete.
For each action in the list the following information is displayed:
Column | Description |
|---|---|
Status | The status of the action: Not Started, In Progress, At Risk, Overdue, or Complete. The action status is manually set. |
Title | The title for the action. |
Equipment | The work center or work unit associated with the action. |
Loss Category | The high-level loss category associated with the action: Scrap, Planned Downtime, Unplanned Downtime, Changeover, Speed Loss, Small Stops, Unknown. |
Reason | The specific loss reason associated with the action. |
Owner | The owner of the action. |
End Date | The target end date of the action. |
When Equipment filter and Date Range are applied, the Total Loss Hours chart displays the total loss hours each day for the specified equipment, as well as the Loss Category if this filter is applied. A data point is plotted on the chart for each day in the date range that falls on or before the current date. If a day has no loss hours, the data point for that day is 0. A day is defined as midnight to midnight in the current user’s time zone. When a work center is selected in the Equipment filter, the total loss hours displayed in the chart is the sum of all events from all work units in the work center. When a work unit is selected in the Equipment filter, the total loss hours displayed in the chart is the sum of all events from the selected work unit.
If a Loss Category filter is applied, the data shown in the Total Loss Hours chart includes data from loss events for which the loss category on the event matches the applied Loss Category filter. The event category for those loss events is not considered for this chart. This is different from the trend charts shown in Performance Analysis. Those trend charts show data from loss events which match the event category, loss category, and loss reason that you selected while navigating through the waterfall and Pareto charts to reach the trend chart. |