Configuring Chart Dashlets
To configure Chart Dashlets:
1. In > Grid Dashlets, in the top left corner, click Create ( ).
).
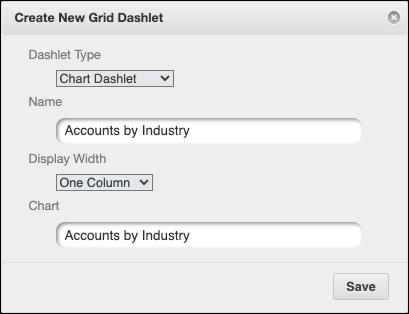
).2. In the Create New Grid Dashlet dialog box, complete the fields as follows, and then click Save.
|
Field
|
Value
|
|---|---|
|
Dashlet Type
|
Chart Dashlet
|
|
Name
|
Enter the name you want to use for the Dashlet.
|
|
Display Width
|
Select One Column or Two Columns.
|
|
Chart
|
Select the Chart you want to show.
|
3. After you link the Chart Dashlet to a new or existing Dashboard and save your changes, view that Dashboard, and then in the top right corner of the Chart Dashlet you want to configure, click See Entire List ( ).
).
).4. In Max Designer, click Developer Tools ( ) > , and then in the left pane, search for and click Chart Dashlet.
) > , and then in the left pane, search for and click Chart Dashlet.5. On the object design page, in the left pane, click Records, and then in the list view, click the relevant Chart Dashlet record.
6. On the record page, configure any of the following options, and then in the top left corner, click Save and Close ( ).
).
).◦ Auto Refresh: Enable or disable auto-refresh.
◦ Auto Refresh Interval: Define how often the list view is automatically refreshed.
|
|
Although charts are created based on list views, the configured Maximum List View Records value in the active System Setting record does not take effect. When charts are rendered, all records are always loaded. For example, if the related list view is configured to show a maximum of 10,000, the sum of all the bars in the rendered chart can be a larger value.
|