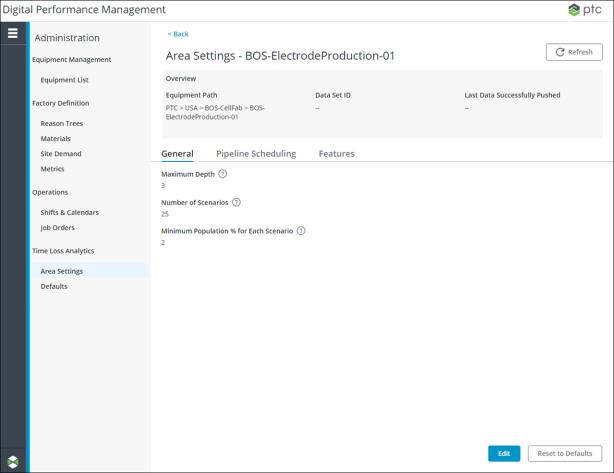
Viewing Area Settings
On the area settings page for an individual area, you can see information about how time loss analytics for the area is configured. From this page, you can manage the general settings for the area, determine the features that are included when calculating insights, and configure the pipelines that are used for establishing and updating the analysis data set for the area.
You can access this page by viewing an area from the Area Settings page.

The Overview pane displays the following information:
• Equipment Path — Shows the path to the area in the equipment hierarchy list, as a breadcrumb.
• Data Set ID — The UUID (universally unique identifier) for the most recent set of data which was successfully pushed to the ThingWorx Analytics Server.
• Last Data Successfully Pushed — Shows the date and time of the last successful push to the ThingWorx Analytics Server.
Initially, the values for Data Set ID and Last Data Successfully Pushed are empty. When data is successfully pushed to the ThingWorx Analytics Server, the values under these fields are updated with new corresponding values.
You can see the following tabs on this page:
• General Tab — Allows you to view and edit the configuration settings for the view loss insights search algorithm.
• Features Tab — Allows you to view and edit the features that will be included when calculating insights for the area.
• Pipeline Scheduling Tab — Allows you to view, edit, and delete the pipelines used to establish and update the analysis data set for the area. You can also view logs related to previously executed pipeline pushes.
Click Refresh to update the field values in the Overview section and the tab which you are currently on. For example, if you are on the Pipeline Scheduling tab, clicking Refresh refreshes the values on the Pipeline Scheduling tab.
Click Back to return to the Area Settings page.