Viewing Loss Insights
Time Loss Analytics, accessed through the View Loss Insights action, automatically searches across the data captured within DPM to find scenarios related to higher amounts of time loss for a selected loss category. The View Loss Insights action works with a standardized data set that includes variables related to the product (for example, the material being produced), people (for example, the shift when the loss occurred), process (for example, the job order that was in production), and time (for example, how far into the shift the loss occurred) captured within DPM.
The View Loss Insights action helps to discover hidden recurring scenarios in the data when searching across longer time ranges. Use the View Loss Insights action when looking at least one month of data (or more than 500 production blocks) to limit the impact of one-time, outlier events skewing the results.
To enable the View Loss Insights action, the data pipeline for the area must be configured and successfully executed. You can configure the data pipeline from > > tab. For more information, see Time Loss Analytics.
To view loss insights for a particular area, complete the following steps:
1. Access the time loss waterfall chart by selecting > from the navigation menu on the left.
2. Apply filters to view data in the waterfall chart. A date range and equipment must be selected before the filters can be applied.
In the Filters pane, select the appropriate filter values:
◦ Date Range—Select the date range for which you want to view data. The date range filter queries based on the current user’s local time zone. If the current date is included in the selected date range, the date range filter queries up to the current time in the user’s local time zone.
◦ Equipment—Select the equipment for which you want to view data. Equipment at any level of the equipment hierarchy, except a work unit, can be viewed in the waterfall chart. When a work center is selected for the equipment filter, you can drill down into Pareto and trend charts.
◦ Material—Select the All option to view data for all materials produced by the selected equipment, or select a specific material for which you want to view data. A specific material can be selected only when the selected equipment is a work center. Multiple materials can be produced by the same equipment. By default, All is selected.
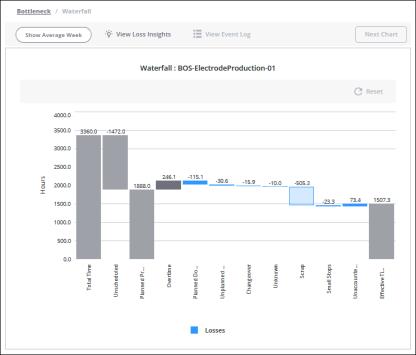
3. Select a blue time loss bar in the waterfall chart and click the View Loss Insights button. The insights for a larger data set may take some time to load. The Loss Insights page for the selected loss category opens. The View Loss Insights action is available only for standard loss categories. The Unaccounted Time bar and bars for custom loss categories are not supported for this action.
