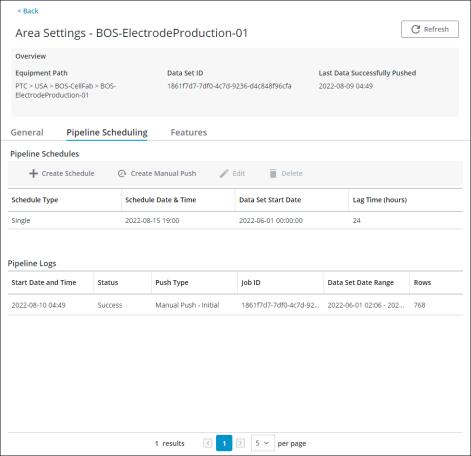
Pipeline Scheduling Tab
On the Pipeline Scheduling tab, you can configure the pipelines that are used for establishing and updating the analysis data set for the area.
A pipeline pushes data from DPM to the Thingworx Analytics Server to create the data set that is used for calculating insights.
A pipeline schedule either creates or appends the analysis data set that is used for calculating insights.
The Pipeline Scheduling tab is made up of two sections:
• Pipeline Schedules— From the Pipeline Schedules table, you can create a schedule, create a manual push, edit a schedule, and delete a schedule. You can only create a maximum of one single and one repeating schedule. If you have set up both a repeating schedule and a single schedule, the Create Schedule button is disabled.
• Pipeline Logs— In the Pipeline Logs table, you can view logs that are related to previously executed pipeline pushes.

The Pipeline Schedules table displays the following information:
• Schedule Type— The type of schedule, either Single or Repeating - <Day of Week>.
• Schedule Date & Time— The date and time when the scheduled push is triggered.
• Data Set Start Date— The start date from which data is pushed to the ThingWorx Analytics Server for calculating insights.
• Lag Time (hours)— The lag time is the delay that allows data used for analysis to be finalized before being pushed to the ThingWorx Analytics Server. Data is not included in the pipeline push until the lag time has elapsed. For example, if the lag time is set to 24 hours, then data is not included in the push until 24 hours after the data was entered.
The Pipeline Logs table displays the following information:
• Start Date and Time— The start date and time of the pipeline push job.
• Status— Shows the status of the pipeline push, either Success, Failed - Network error. Try again or contact your PTC Cloud Administrator, or Failed - System error. Contact your PTC Cloud Administrator.
• Push Type— Shows the push type, either Scheduled Push, Manual Push - Initial, Manual Push - Add Data Since Last Push, or Manual - Delete and Recreate.
• Job ID— The unique identifier of the job from the ThingWorx Analytics Server.
• Data Set Date Range— The date range of data collected in the pipeline push.
• Rows— The number of rows in the data set.