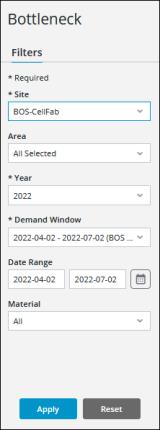
Filtering Bottleneck
The information displayed in the bottleneck chart is determined by the filters that are applied. These filter selections are passed along when navigating from the bottleneck chart to the waterfall chart. A site, year, and demand window must be selected before the filters can be applied.

To apply filters, complete the following steps:
1. In the Filters pane, select the appropriate filter values:
◦ Site—Select the site for which you want to view bottleneck data. Required.
◦ Area—Select the All option to view data for all areas in the selected site, or use the checkboxes to select one or more areas for which you want to view data. By default, All is selected.
◦ Year—Select a year. All years in which there are demand windows for the selected site are listed. Required.
The year being queried is considered as midnight to midnight, 01-01 to 12-31, in the current user’s local time zone. If the difference between the site time zone and the current user’s local time zone results in the start or end date of a demand window falling in a different year, both years are listed in the drop-down.
◦ Demand Window—Select the demand window for which you want to view bottleneck data. All demand windows in the selected year for the selected site are listed, with the exception of demand windows in the current year which have start dates in the future. Required.
The duration of a demand window is from midnight to midnight of the start and end dates, in the site’s time zone. In the Demand Window filter drop-down list, the start and end dates for a demand window are shown for the current user’s local time zone. Depending on the difference between the site’s time zone and the current user’s local time zone, this may result in different dates shown in the filter drop-down list than the dates defined for the demand window in Site Demand. For example, consider a site in Eastern Standard Time which has a demand window with an end date of 2022-03-31. For a user in India Standard Time, the end date in the Demand Window filter drop-down list for this demand window appears as 2022-04-01.
◦ Date Range—Select a date range within the selected demand window for which you want to view data. This allows you to focus on specific dates within a larger demand window. The dates in the Date Range filter are midnight to midnight in the current user’s local time zone. The selected dates must be within the start and end dates of the selected demand window, midnight to midnight in the site time zone.
◦ Material—Select the All option to view data for all materials that could be produced at the selected site and area (if any) during the selected demand window, or select a specific material for which you want to view data. Selecting a specific material filters the data shown to those work centers that have produced the selected material or any child materials in the demand BOM for the selected material during the selected demand window. By default, All is selected.
2. Click Apply. The bottleneck chart displays the data that satisfies the selected filters.
When there is no Date Range filter applied, the data shown in the chart is for midnight to midnight of the selected demand window’s start date and end date, in the time zone of the selected site. When a Date Range filter is applied, the data shown in the chart is from midnight to midnight of the selected date range, in the current user’s local time zone. |
Click Reset to clear all selections in the Filters pane. This does not impact the data that is currently displayed in the bottleneck chart.
Filter Selections When Navigating from Bottleneck to Waterfall
If you navigate to waterfall from bottleneck by selecting the bar for a work center and clicking Next Chart, the waterfall chart filters are automatically applied as follows:
• The work center represented by the selected bar is applied as the Equipment filter selection for the waterfall chart.
• If there is a Date Range filter is applied in the bottleneck chart, that date range is applied as the Date Range filter selection for the waterfall chart.
• If there is no Date Range filter applied in the bottleneck chart, the start and end dates for the Demand Window filter selection are applied as the Date Range filter selection for the waterfall chart.
• If a specific material is selected in the Material filter for the bottleneck chart, that material is applied as the Material filter selection for the waterfall chart.