Filtering Waterfall
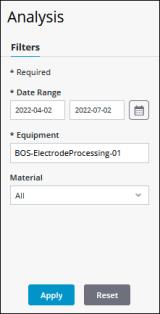
The information displayed in the waterfall chart is determined by the filters that are applied. After it is applied, the filter is retained as you navigate between the time loss waterfall, loss reason Pareto, and trend analysis charts. If you drill-down from the waterfall chart into Pareto or trend charts and then apply new filter selections, you are returned to the waterfall chart displaying the newly applied filters. If you navigate to the waterfall chart from the bottleneck chart, the waterfall chart filters are automatically applied based on the bottleneck filter selections.
A date range and equipment must be selected before the filters can be applied.

To apply filters, complete the following steps:
1. In the Filters pane, select the appropriate filter values:
◦ Date Range—Select the date range for which you want to view data. The date range filter queries based on the current user’s local time zone. If the current date is included in the selected date range, the date range filter queries up to the current time in the user’s local time zone.
◦ Equipment—Select the equipment for which you want to view data. Equipment at any level of the equipment hierarchy, except a work unit, can be viewed in the waterfall chart. When a work center is selected for the equipment filter, you can drill down into Pareto and trend charts.
◦ Material—Select the All option to view data for all materials produced by the selected equipment, or select a specific material for which you want to view data. A specific material can be selected only when the selected equipment is a work center. Multiple materials can be produced by the same equipment. By default, All is selected.
2. Click Apply. The waterfall chart displays the data that satisfies the selected filters.
Click Reset to clear all selections in the Filters pane. This does not impact the data that is currently displayed.