Schedule Optimization Monitoring and Analytics
You can monitor and analyze Schedule Optimization usage and effectiveness in several ways. The Scheduling Analytics Dashboard provides Service Board usage data such as the number of Jobs dispatched, total Propose Schedule executions, and the number of Appointments proposed and saved for specific user sets and time ranges. Additionally, you can use schedule and Appointment metrics to generate usage reports in Salesforce, and configure optimization logging levels to monitor the time cost to construct optimization payloads. You can also grant access to the Scheduling Analytics Dashboard to dispatchers, so that they can monitor their schedule-optimized Jobs.
Service Board usage data on Schedule Optimization is stored internally on ServiceMax systems. Charts are generated by an API, and all data is stored internally in Service Board. To provide full access to this data, you can generate embedded Scheduling Analytics charts and configure dashboards to view them in Max Admin. Additionally, to analyze usage statistics from multiple perspectives, you can define and generate customized Scheduling Analytics Reports in .csv format that include both analytical data and user and group field values, and save configured report criteria as templates that you can reuse and update as needed.
|
|
Only users who have the System Admistrator role can create, update, and delete Scheduling Analytics Chart Dashlet records. Users who have the Standard User role have view-only permissions.
|
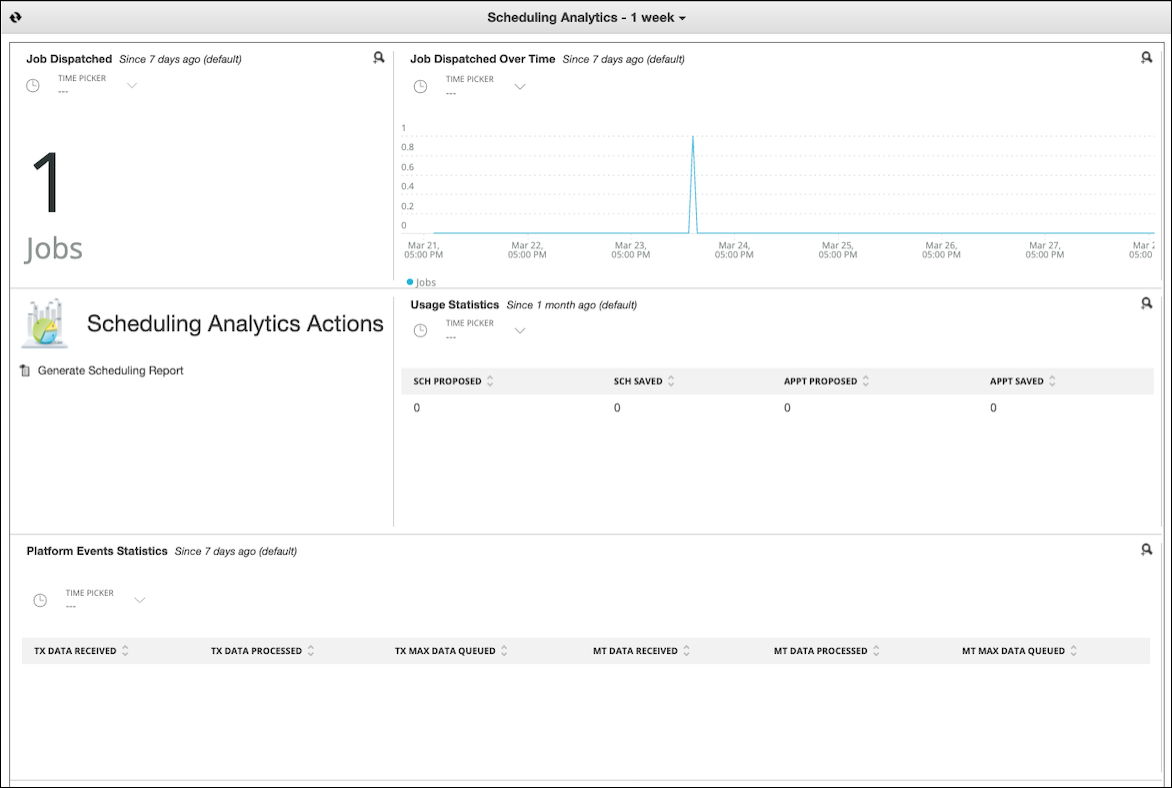
Service Board ships with six predefined Scheduling Analytics Chart Dashlets, preconfigured on one dashboard linked to Max Admin.
Records of the Scheduling Analytics Chart Dashlet object are used to show generated charts in Service Board. All users with the Standard User role can view Scheduling Analytics Chart Dashlets, but only users with the System Administrator role can create, update, or delete the related records, which have the following fields:
|
Field
|
Data Type
|
Description
|
|---|---|---|
|
Name
|
String
|
Primary name of the Dashlet that appears on the dashboard.
|
|
Scheduling Analytics Chart
|
Option List
|
The Scheduling Analytics chart for which this Dashlet shows data. Only the following charts are supported:
• Job Dispatched
• Job Dispatched Over Time
• Usage Statistics
• Platform Events Statistics
• Transaction Platform Event Queue Backlog
• Master Data Platform Event Queue Backlog
• Transaction Callback Platform Event Queue Backlog
|
|
Default Duration
|
Option List
|
The default duration for which this Dashlet shows data. The following options are available:
• 5 minutes
• 30 minutes
• 60 minutes
• 3 hours
• 6 hours
• 12 hours
• 24 hours
• 3 days
• 7 days
• 1 month
• 3 months
• 6 months
Generated charts always show configured default durations when initially generated. Users can temporarily select other durations when viewing charts on the Scheduling Analytics Dashboard, but their changes are not saved. If this field value is updated in Scheduling Analytics Chart Dashlet records, new charts are automatically generated on save.
|
|
Display Width
|
Option List
|
The number of columns this Dashlet uses on the dashboard. The following options are available:
• One Column
• Two Columns
• Three Columns
|