Configuring and Viewing Application Dashboards
You can configure Dashboards for applications by using any combination of preconfigured or custom Dashlets, and easily view them from within those applications.
To configure and view application dashboards:
1. In Max Designer, click Developer Tools ( ) > , and then in the left pane, search for and click Dashboard.
) > , and then in the left pane, search for and click Dashboard.2. On the object design page, in the left pane, click Records, and then do one of the following:
◦ To configure a new Dashboard, in the top left corner, click Create ( ).
).
).◦ To edit an existing Dashboard, click its name in the list.
3. On the record page, in the Name field, enter or edit the name for the Dashboard, and then in the top left corner, click Save ( ).
).
).4. In the top right corner, click Options ( ) > , and then in Dashboard Designer, in the Roll Dashlets section, do one of the following:
) > , and then in Dashboard Designer, in the Roll Dashlets section, do one of the following:◦ To add a Snippet, in the top left corner, click Link ( ), and then in the Specify Roll Dashlet dialog box, select and link a Snippet.
), and then in the Specify Roll Dashlet dialog box, select and link a Snippet.◦ To remove a Snippet, click the Delete button in its top right corner.
5. In the Grid Dashlets section, do one of the following:
◦ To add a Dashlet, in the top left corner, click Link (), and then in the Specify Grid Dashlet dialog box, in the Dashlet Type list, click a Dashlet type and select and link a Dashlet.
), and then in the Specify Grid Dashlet dialog box, in the Dashlet Type list, click a Dashlet type and select and link a Dashlet.◦ To create a new Dashlet, in the top left corner, click Create ()
)◦ To remove a Dashlet, click the Delete button in its top right corner.
6. Repeat the previous steps to add or remove more Snippets and Dashlets, and then in top right corner of each newly added item, click the numeral to adjust the column width from the existing setting to a different value if needed, and save the record.
|
|
By default, you can add up to 8 Chart Dashlets per Dashboard. This limit is configured in the Maximum Charts Per Dashboard setting, which is user-modifiable.
|
7. In the Applications list view, open the application to which you want to link your newly created Dashboard, and then on the Dashboards tab, in the top left corner, click Link ().
).8. Select and link the new Dashboard, and then in the top left corner, click Save and Close ( ).
).
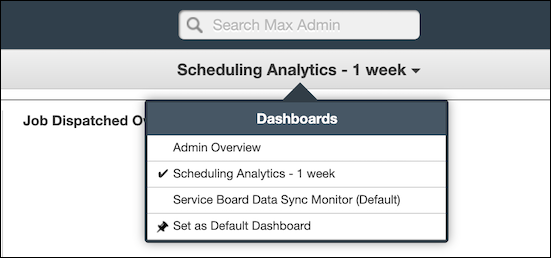
).9. To view the newly linked Dashboard, open the related application, and then in the view selection list, click its name.