Project Gantt Chart
After you import a project file or click a row in the Projects List to open a Project, the Project Gantt Chart appears.
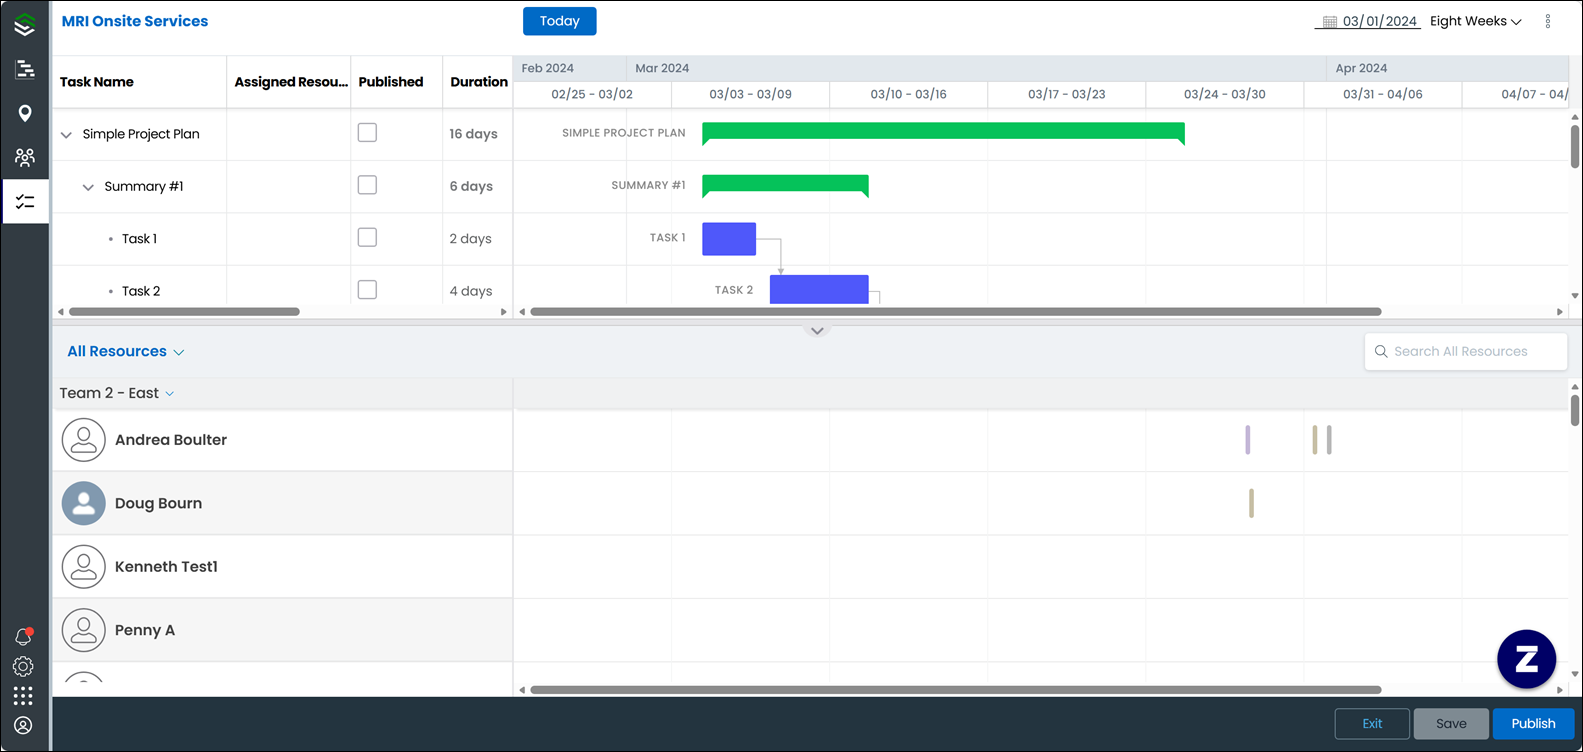
The Project Gantt Chart includes the following features and options:
• View Options: You can click Today to view Project scheduling information for the current day in the top left corner, or select a starting date and Preset Date Range in the top right corner. When you hover your mouse pointer over the upper date headers, you zoom out to longer time intervals, and when you hover over the lower date headers, you zoom in to shorter time intervals.
• Task List: You can click the column headers to sort and select which columns to show or hide. In the task rows, you can expand and collapse nodes to view Project stages and their associated Project Tasks, and right-click selected Project Tasks to open a context menu with options to edit or modify their settings and information.
• Gantt Chart: Project Tasks are shown cross-aligned with their relevant rows in the Task List. You can hover your mouse pointer over task blocks to view schedule and status information in tooltips, or right-click to open a context menu with options to edit or modify their settings and information.
• Scheduler Calendar: By default, when the Project Gantt Chart first appears, the Scheduler Calendar is hidden. You can click the arrow in the border bar above its heading to open and close this pane. Appointments scheduled to complete Tasks shown in the Gantt Chart appear in a Scheduler Calendar that includes a Project Resource List and Search All Resources field.
Project Gantt Chart in Classic Mode
The Classic user interface retires on November 8, 2026. All features are available in the Service Board Modern interface. We recommend switching to Service Board Modern at your earliest convenience to access the latest features. |
After you import a project file or click a row in the Projects List to open a Project, the Project Gantt Chart appears.
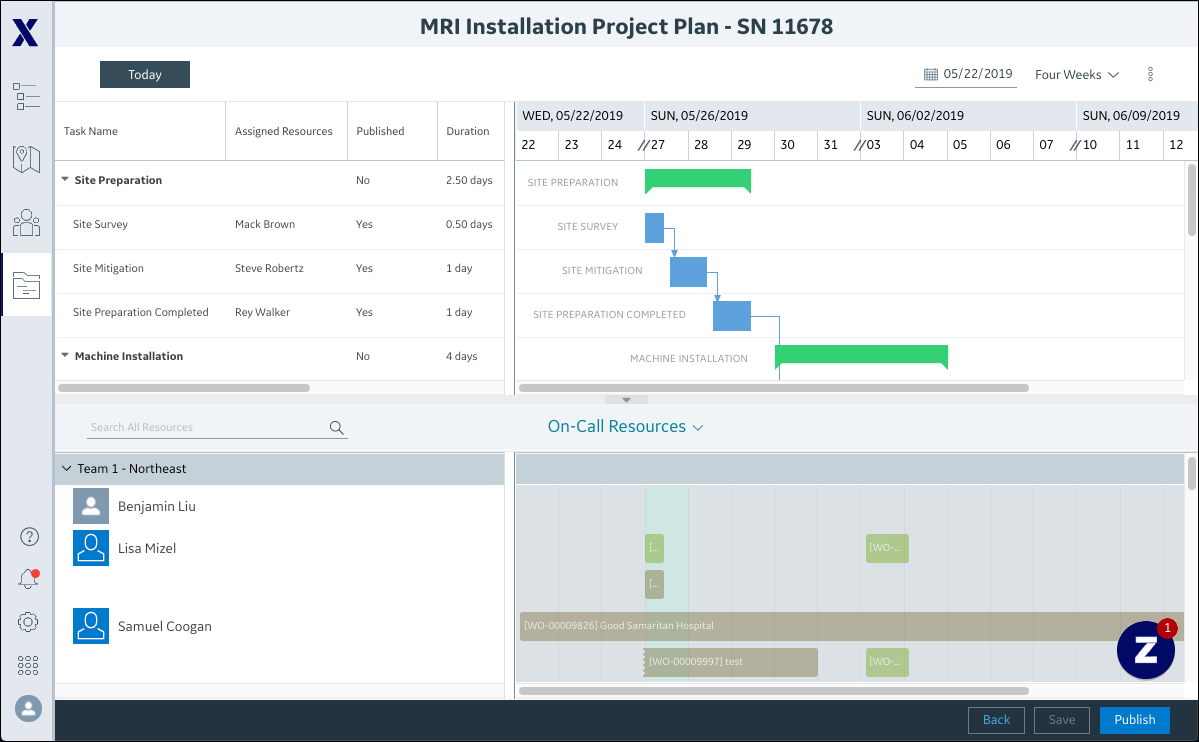
The Project Gantt Chart includes the following features and options:
• View Options: You can click Today to view Project scheduling information for the current day in the top left corner, or select a starting date and Preset Date Range in the top right corner. When you hover your mouse pointer over the upper date headers, you zoom out to longer time intervals, and when you hover over the lower date headers, you zoom in to shorter time intervals.
• Task List: You can click the column headers to sort and select which columns to show or hide. In the task rows, you can expand and collapse nodes to view Project stages and their associated Project Tasks, and right-click selected Project Tasks to open a context menu with options to edit or modify their settings and information.
• Gantt Chart: Project Tasks are shown cross-aligned with their relevant rows in the Task List. You can hover your mouse pointer over task blocks to view schedule and status information in tooltips, or right-click to open a context menu with options to edit or modify their settings and information.
• Scheduler Calendar: By default, when the Project Gantt Chart first appears, the Scheduler Calendar is hidden. You can click the arrow in the border bar above its heading to open and close this pane. Appointments scheduled to complete Tasks shown in the Gantt Chart appear in a Scheduler Calendar that includes a Project Resource List and Search All Resources field.
Related Topics