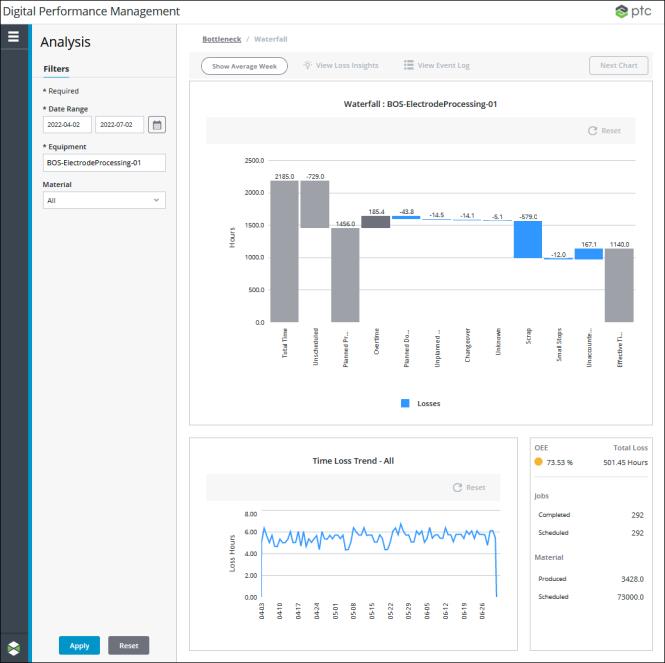
Waterfall
The time loss waterfall chart visualizes global losses, providing a framework for understanding high-level loss categories. From the waterfall chart, you can drill down through the loss reason Pareto charts for the various loss reasons to the trend analysis charts for the lowest level reason of a reason tree branch.
You can access the time loss waterfall chart directly by selecting > from the navigation menu on the left. You can also navigate to the waterfall chart from the bottleneck chart by selecting a work center in the waterfall chart, and clicking Next Chart.

Apply date range and equipment filters to view data in the waterfall chart.