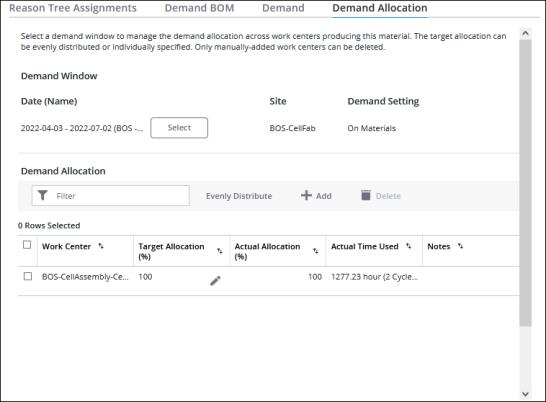
Demand Allocation Tab
From the Demand Allocation tab, you can specify the amount of a material that you expect each work center to produce by allocating percentages of the material’s demand for a selected demand window to the work centers that produce the material. This allows you to compare the expectation for each work center against what is actually produced on each work center.
You can access this tab by viewing a material and clicking Demand Allocation.
When the demand for the demand window is Set on Materials, this allocation is used to calculate the total demand for the work centers as part of identifying production bottlenecks. When the demand for the demand window is Set on Work Centers, you can edit the information on the Demand Allocation tab without impacting the bottleneck analysis.

By default, the Demand Allocation table lists the work centers which can produce the material in the site to which the selected demand window applies. These are the work centers which list the current material on their Material Settings tab. You can also manually add work centers to this table for allocation purposes, and delete any manually added work centers from the table.
For each work center, the following information is displayed:
• Work Center—The name of the work center. Any manually added work center is indicated by an asterisk after the name, for example, Work_Center_1*.
• Target Allocation (%)—The percentage of the material demand that is allocated to this work center. This value must be manually entered. The displayed value is rounded to 2 decimal places, though the value that is entered can include additional decimal places.
• Actual Allocation (%)—The percentage of the total quantity (good and scrap) of the material that has been produced on this work center. This value is calculated as the total quantity produced by this work center divided by the total quantity produced by all work centers. The displayed value is rounded to 2 decimal places.
• Actual Time Used—The total amount of time in hours that is used by this work center in producing the material. This value is calculated as the total quantity (good and scrap) produced by this work center multiplied by the ideal cycle time for the material on this work center.
• Notes—Indicates when a work center has been manually added to the list. Only manually added work centers can be deleted from the list.
In the table footer, the Total Count field displays the total number of work centers that are listed in the table. The Total Target Allocation field displays the total percentage of the demand that has been allocated between the work centers. The total allocation can be less than, but cannot be more than 100.
The Demand Allocation table is initially sorted on the Work Center column, in ascending order. You can sort the list on any column. Moving between pages does not impact the sorted list.
To narrow down the list of work centers, enter text in the Filter field. The list can be filtered on any column.
Whenever a work center is added to this table, either manually or by having the material added to the list of materials that it produces, its Target Allocation (%) is initially 0.