Understanding Data Quality Analysis Results
The Data Quality Analysis report helps you review the quality and readiness of data used for scheduling and optimization. The report highlights gaps in capacity, demand, skills, resources, and optimization objectives. Each section focuses on a specific area and runs independently. Use the report to identify data issues early and plan corrective actions before running optimization jobs. This improves schedule accuracy and overall optimization results.
The following table describes the different analysis sections included in the Data Quality Analysis report.
|
|
• Required Skills and Required Resources display only the top 10 entries.
• Each section runs independently and has no dependency on other sections. For example, Capacity vs Demand Analysis – Overall Capacity and Capacity vs Demand Analysis – Capacity Distribution to Fulfil SLA are separate analyses.
• Missing data in one section does not impact or relate to the results shown in another section.
|
|
Category
|
Description
|
|---|---|
|
Capacity vs Demand Analysis — Overall Capacity
|
Provides a high-level view of available capacity compared to service demand. This helps identify whether the system has enough resources to meet planned workloads. For more information, see Capacity vs Demand Analysis — Overall Capacity./
|
|
Capacity vs Demand Analysis — Capacity Distribution to Fulfil SLA
|
Shows how capacity is distributed to meet Service Level Agreements (SLAs). This highlights risks where SLA commitments may not be met due to uneven capacity allocation. For more information, see Capacity vs Demand Analysis — Capacity Distribution to Fulfil SLA.
|
|
Capacity vs Demand Analysis — Skill Analysis
|
Analyses whether the required skills are available to meet demand. This helps identify skill shortages or mismatches that may affect scheduling outcomes. For more information, see Capacity vs Demand Analysis — Skill Analysis.
|
|
Capacity vs Demand Analysis — Resource Requirement
|
Identifies the number and type of resources required to fulfil demand. This supports workforce planning and optimization decisions. For more information, see Capacity vs Demand Analysis — Resource Requirement.
|
|
General Anomaly — General Observations
|
Highlights general data anomalies detected during analysis. These observations point to data inconsistencies that can impact optimization quality. For more information, see General Anomaly — General Observations.
|
|
Optimization Objective Analysis — Biased Objectives
|
Identifies optimization objectives that may be overly weighted. Biased objectives can skew scheduling results and reduce overall efficiency. For more information, see Optimization Objective Analysis — Biased Objectives.
|
|
Optimization Objective Analysis — Objective Contradictions
|
Detects conflicts between optimization objectives. Contradictory objectives can lead to suboptimal or unstable scheduling results. For more information, see Optimization Objective Analysis — Objective Contradictions.
|
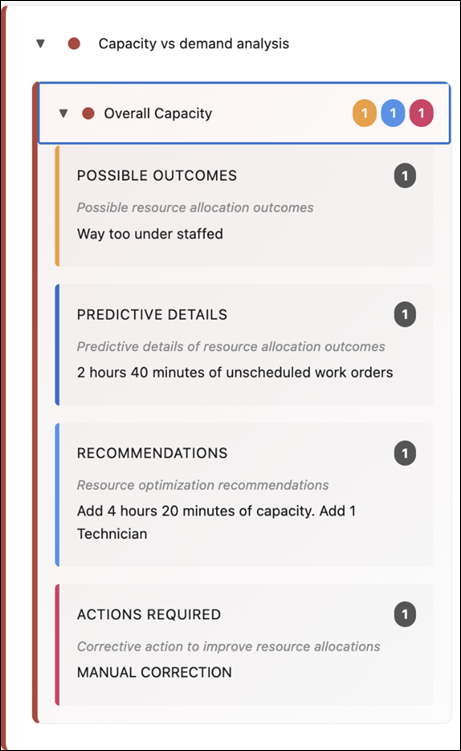
Capacity vs demand analysis — Overall Capacity
Evaluates whether available capacity across the planning horizon is sufficient to schedule the expected workload. It identifies under-scheduling risk, quantifies likely unscheduled work, and recommends capacity corrections such as adding technicians or extending the horizon. The following image displays an example for Overall Capacity.
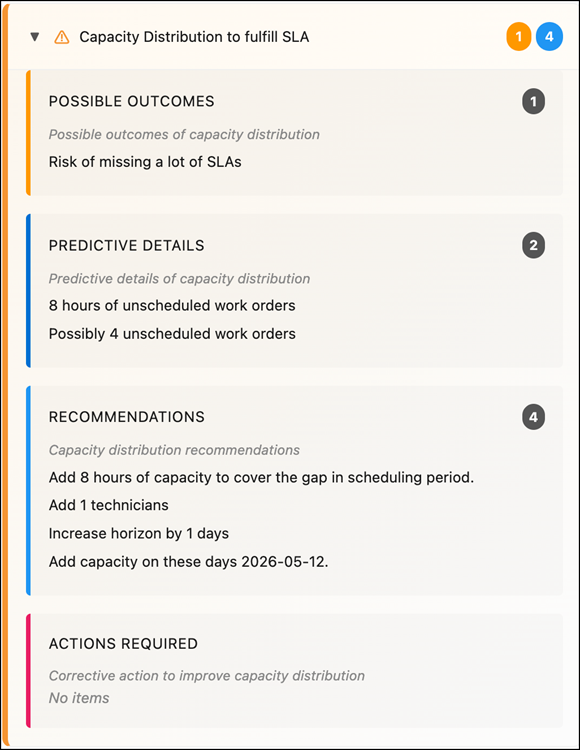
Capacity vs demand analysis — Capacity Distribution to fulfill SLA
Evaluates how capacity is distributed over time to meet SLA commitments. It highlights SLA breach risk, identifies unscheduled demand by day range, and proposes targeted corrections such as day-specific capacity additions, technician increases, or horizon extension. The following image displays an example for Capacity Distribution to fulfill SLA.
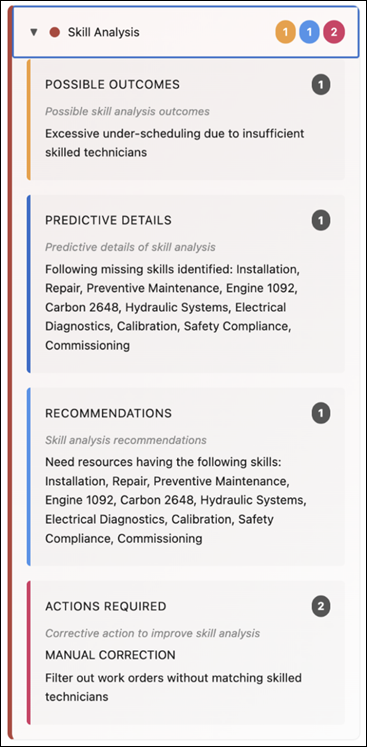
Capacity vs demand analysis — Skill Analysis
Analyzes scheduling risk caused by skill mismatches between required work order skills and available technician skills. It identifies missing skill coverage and recommends adding or allocating appropriately skilled resources to reduce under-scheduling. The following image displays an example for Skill Analysis.
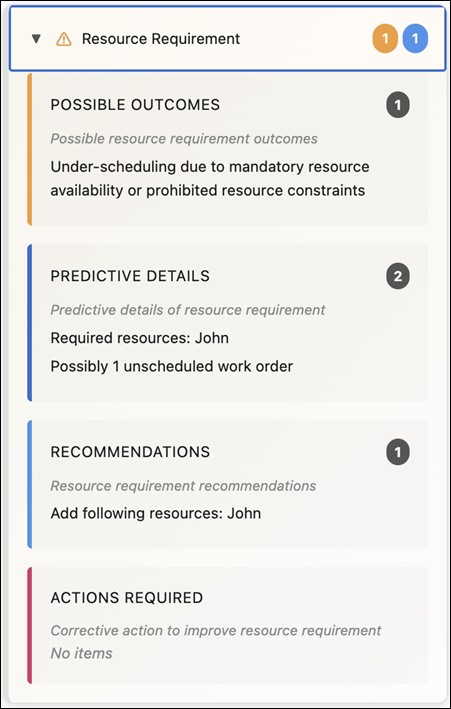
Capacity vs demand analysis — Resource Requirement
Evaluates under-scheduling risk related to mandatory or prohibited resource constraints. It determines whether required resources are available for demand and recommends corrective actions such as adding required resource capacity. The following image displays an example for Resource Requirement.
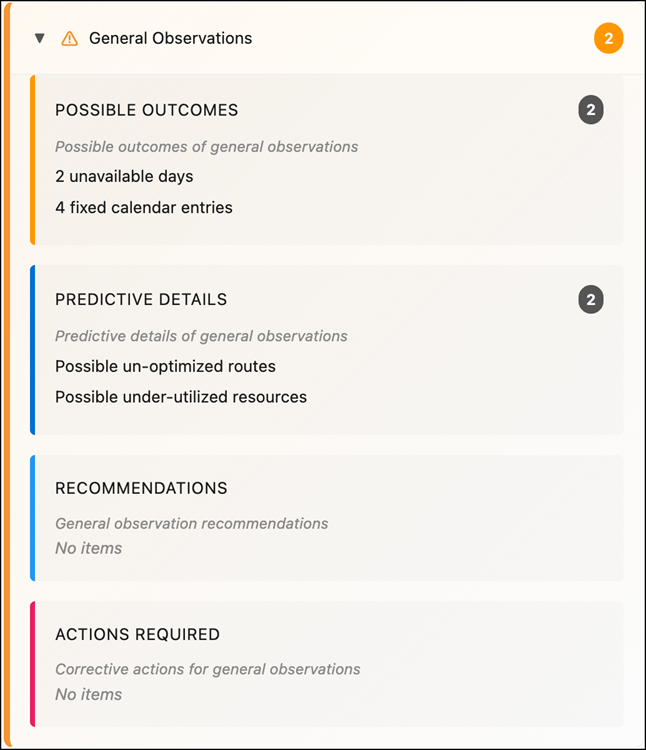
General anomaly — General Observations
Provides a broad anomaly scan of scheduling conditions, with focus on structural calendar and availability patterns that can reduce optimization quality. It flags conditions such as many unavailable days or fixed calendar entries that can lead to unoptimized routes and under-utilized resources. The following image displays an example for General Observations.
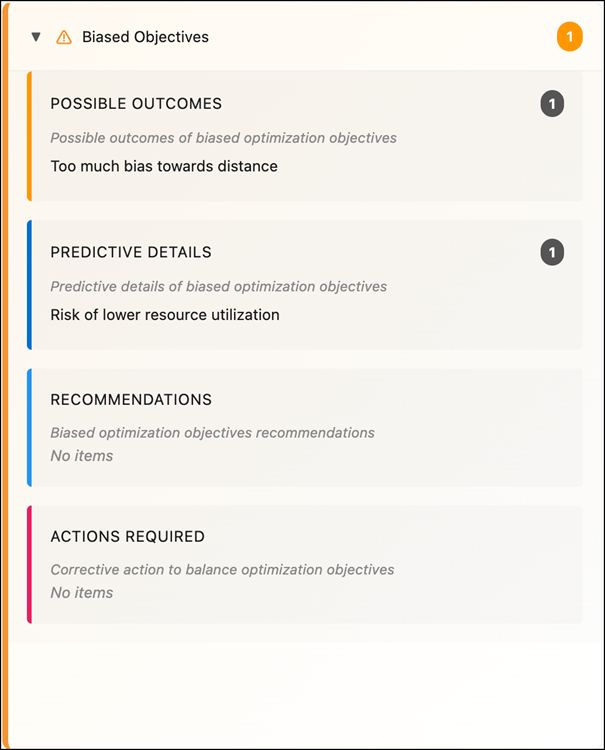
Optimization objective analysis — Biased Objectives
Analyzes whether optimization objective weights are overly biased toward a single target, such as distance or SLA. It helps identify trade-off imbalance that can increase SLA risk or lower resource utilization, and supports objective rebalancing. The following image displays an example for Biased Objectives.
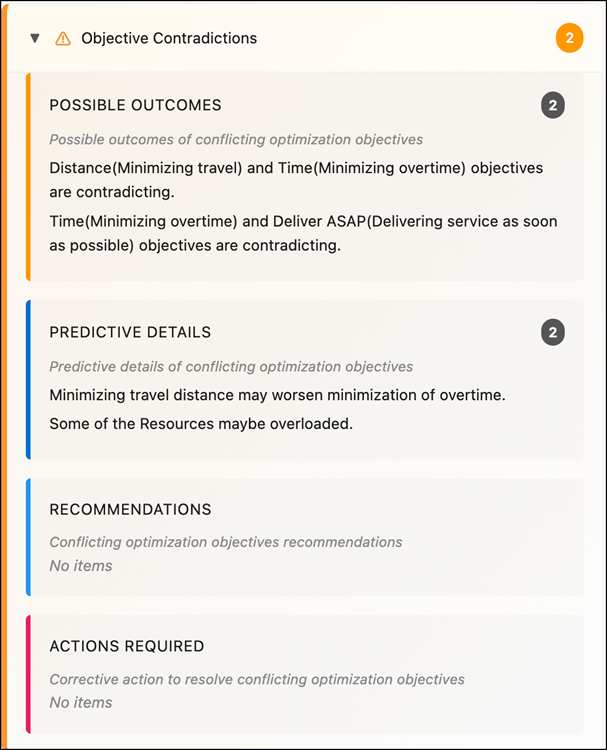
Optimization objective analysis — Objective Contradictions
Detects contradictions between optimization objectives, such as competing distance and time goals. It highlights scenarios that can produce inconsistent or unpredictable scheduling results and indicates the need for objective alignment. The following image displays an example for Objective Contradictions.
Related Topics