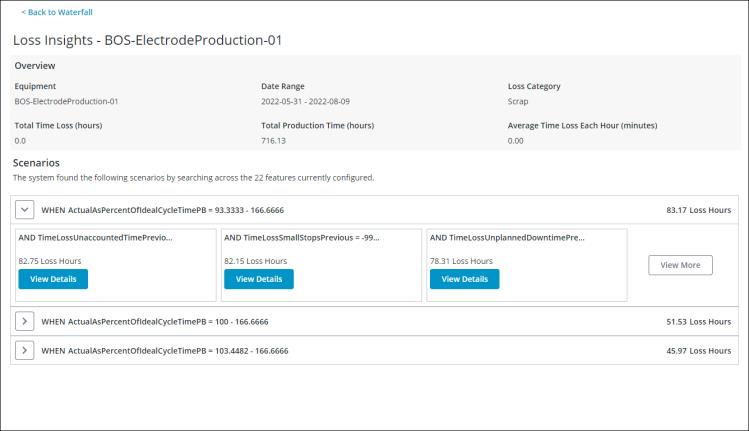
Loss Insights
On the Loss Insights page you can view the insights and scenarios that Time Loss Analytics has derived from data gathered from DPM. You can manage the features which are included when calculating insights for an area from the Features tab.
The Loss Insights page is divided into two sections:
• Overview

Overview
The Overview pane displays the following information:
• Equipment—The area or work center for which you are viewing the loss insights.
• Date Range—The date range for which you are viewing the loss insights.
• Loss Category—The loss category for which you are viewing the loss insights. This is the loss category for the blue bar that you selected in the waterfall chart.
• Total Time Loss (hours)—The total time loss of the selected loss category for the production blocks within the selected date range on the selected equipment. This value is shown in hours.
• Total Production Time (hours)—The total production time for all production blocks within the selected date range for the selected equipment. This value is shown in hours.
• Average Time Loss Each Hour (minutes)—The average time loss per hour for the selected loss category for the selected equipment. This value is shown in minutes.
Scenarios
The Scenarios pane displays scenarios that have higher amounts of time losses for the insights that you are viewing. Each scenario is described by one or more variables, called features. These features correlate with time loss to provide more information on common conditions which are associated with more losses. For more information on features, see the feature list.
Scenarios are generated by using an advanced search algorithm across a data set. The data set creation process gathers production block data from within DPM, aggregates time losses for each production block, gathers relevant information related to each production block, and calculates new data. Once the data set is created, the system searches across this data to find scenarios that result in higher amounts of time loss.
A scenario contains one or more variables that when combined together represent a section of the data that has a higher amount of time loss. A parent scenario can have child scenarios. For example, a parent scenario, WHEN Day of Week = Monday, has 10 loss hours due to scrap. Under this parent scenario there is a more specific child scenario, AND Shift = Day, which has 7 hours of time loss due to scrap. The combination of parent and child scenarios identifies that WHEN Day of Week = Monday AND Shift = Day there are 7 hours of time loss.
To view more details for a particular scenario, click View Details.
Click View More to view additional scenarios.
Click Back to Waterfall button to return to the waterfall chart.