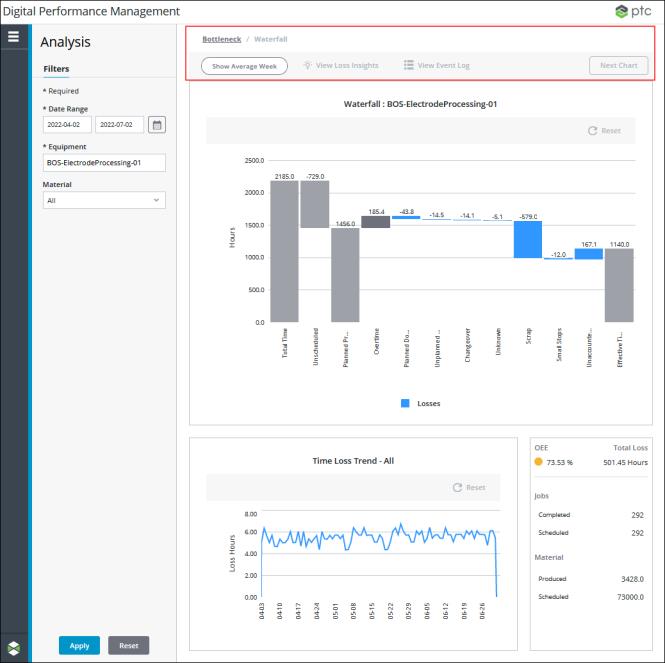
Analysis Header Mashup
The analysis header mashup (PTC.PerformanceAnalysis.AnalysisHeader_MU) displays the navigation breadcrumb, Show Average Week button, View Loss Insights button, View Event Log button, and Next Chart button for moving between the waterfall, Pareto, and trend charts.

When a work center is selected in the Equipment filter, you can select a blue bar in the waterfall chart and click Next Chart to drill down into the loss reason Pareto charts for that loss category. From a Pareto chart, select a bar and click Next Chart to drill down to the next level of Pareto charts or to the trend chart for the lowest level reason for that reason category. To move back up the levels of Pareto charts to the time loss waterfall chart, or to navigate to the bottleneck chart, click a link in the navigation breadcrumb.
Widgets
The PTC.PerformanceAnalysis.AnalysisHeader_MU mashup has the following widgets:
• A Breadcrumb widget, for the navigation breadcrumb.
• A Toolbar widget, for the various buttons.
Inputs
The input parameters for the PTC.PerformanceAnalysis.AnalysisHeader_MU mashup are:
• materialMasterUid—The UID for the material selected in the applied Material filter.
• equipmentUID—The UID for the equipment in the applied Equipment filter.
• equipmentName—The display name of the equipment selected in the applied Equipment filter.
• startDate——The start date from the applied Date Range filter.
• endDate——The end date from the applied Date Range filter.
• isEnterpriseOrRegion—A Boolean indicating whether the equipment that is selected in the applied Equipment filter is an enterprise or a region.
• selectedBar—An infotable containing the information for the bar that is selected in the waterfall or Pareto chart.
• selectedBarChanged—The timestamp when the bar was selected.
• normalizeState—A Boolean indicating the state of the Show Average Week button.
• isWorkCenter—A Boolean indicating whether the equipment selected in the Equipment filter is a work center.
• managerName—The name of the manager Thing from which the services on this mashup are run. This value is passed in from the main Performance Analysis mashup (PTC.PerformanceAnalysis.Analysis_MU).
• navigationHistory—An infotable containing the navigation history of the selected loss categories and reasons as you navigate through the waterfall and Pareto charts.
• thingName—The name of the Thing for the equipment selected in the applied Equipment filter.
• updateMashupState—A Boolean indicating whether the contained mashup displaying the waterfall, Pareto, or trend chart needs to be refreshed.
Outputs
The output parameters for the PTC.PerformanceAnalysis.AnalysisHeader_MU mashup are:
• bottomChild2LinkMashup—capacity panel mashup name.
• bottomChild1LinkMashup—trend panel mashup name.
• chartTitle—The loss reason sequence shown in the chart title.
• linkMashup—The name of the chart mashup to be shown in the contained mashup of the PTC.PerformanceAnalysis.Analysis_MU.
• mashupTitle—The value for the first part of the chart title, indicating whether the chart is a waterfall, Pareto, or trend chart.
• navigationHistory—An infotable containing the navigation history of the selected loss categories and reasons as you navigate through the waterfall and Pareto charts.
• normalizeState—A Boolean indicating the state of the Show Average Week button.
• updateMashupState—A Boolean indicating whether the contained mashup displaying the waterfall, Pareto, or trend chart needs to be refreshed.
• equipmentUID—The UID for the equipment in the applied Equipment filter.
• equipmentName—The display name of the equipment selected in the applied Equipment filter.
• startDate——The start date from the applied Date Range filter.
• endDate——The end date from the applied Date Range filter.
• normalizeState—A Boolean indicating the state of the Show Average Week button.
Services
The mashup uses following service on the PTC.PerformanceAnalysis.Manager:
• GetToolbarConfiguration—Retrieves the buttons to display in the toolbar.
The mashup uses the following dynamic services from the PTC.PerformanceAnalysis.Management_TS Thing Shape:
• AddNavigationHistory—Adds a new row to the navigationHistory infotable. This service is called when the Next Chartbutton is clicked.
• DeleteNavigationHistory—Removes the last row from the navigationHistory infotable, and deletes the data from the remaining last row.
• GetBreadcrumbHistory—Retrieves the data for the navigation breadcrumb from the navigationHistory table.
• GetCurrentNavigationHistoryRow—Retrieves the data for the mashups to show in the main chart pane and the two bottom panes from the navigationHistory table.
• GetRootMashupConfiguration—Retrieves the mashup specified in the mashupConfiguration configuration table on the PTC.PerformanceAnalysis.Manager Thing for the id field with the value of PTC.PerformanceAnalysis.Root
• InitializeNavigationHistory—Initializes the navigationHistory table.
• ResetNavigationHistory—Clears the rows of the navigationHistory table.
• UpdateChartNavigationHistory—Updates the navigationHistory infotable based on the bar that is selected in the waterfall or Pareto chart.
The mashup uses the following dynamic services from the PTC.PerformanceAnalysis.TLAN.Management_TS Thing Shape:
• CreateEquipmentInfoJSON—Creates the JSON used to retrieve insights for the equipment that is selected in the applied Equipment filter.
• IsWorkCenterOrArea—Determines whether the equipment that is selected in the applied Equipment filter is a work center or area.
Dynamic services allow you to select the entity to execute a service at runtime. In this case, the service can be executed from any entity that implements the PTC.PerformanceAnalysis.Management_TS Thing Shape. For more information, see Dynamic Services in the Mashup Builder section of the ThingWorx Help Center.