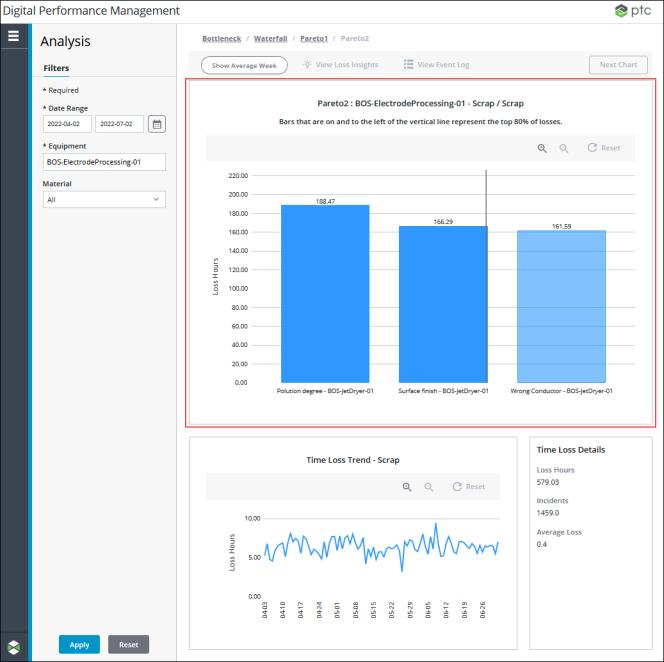
Pareto Chart Mashup
|
|
This mashup is designed to be easily replaced with a customized mashup so long as the customized mashup has the same inputs and outputs. For more information, see Replacing Modular Mashups.
|
The Pareto chart mashup (PTC.PerformanceAnalysis.Pareto_MU) displays bars for the child reasons of the selected reason category or reason in descending order. Bars that are on and to the left of the vertical line represent the top 80% of losses for the selected reason category or reason.

The information displayed in the Pareto chart is determined by the applied filter selections, and the reason category or reason selected in the previous chart. Select a bar in the Pareto chart to drill-down to the next level of information. If the next level is a reason that has children, then another Pareto chart displays for that reason. If the next level reason has no children, then a trend chart displays.
For more information, see Loss Reason Pareto Charts.
Widgets
The PTC.PerformanceAnalysis.Pareto_MU mashup uses a single Pareto Chart widget.
Inputs
The input parameters for the PTC.PerformanceAnalysis.Pareto_MU mashup are:
• chartTitle—The title displayed in the chart widget.
• endDate—The end date from the applied Date Range filter.
• managerName—The name of the manager Thing from which the services on this mashup are run.
• materialMasterUid—The UID for the material selected in the applied Material filter.
• navigationHistory—An infotable containing the navigation history of the selected loss categories and reasons as you navigate through the waterfall and Pareto charts. Used by the GetParetoDisplayData service to build the tooltip for the Pareto chart.
• normalizeState—A Boolean indicating the state of the Show Average Week button.
• startDate—The start date from the applied Date Range filter.
• thingName—The name of the Thing for the equipment selected in the applied Equipment filter.
Outputs
The output parameters from the PTC.PerformanceAnalysis.Pareto_MU mashup are:
• selectedBar—An infotable containing the information for the bar that is selected in the waterfall or Pareto chart.
• selectedBarChanged—The timestamp when the bar was selected.
Services
The mashup uses the following dynamic services from the PTC.PerformanceAnalysis.Management_TS Thing Shape:
• GetCurrentParetoDisplayData—Retrieves the correct data set to display from the GetParetoDisplayData service output, based on the normalizeState setting.
• GetParetoDisplayData—Retrieves both display data sets for the Pareto chart: the actual data and the normalized data (data for an average week).
Dynamic services allow you to select the entity to execute a service at runtime. In this case, the service can be executed from any entity that implements the PTC.PerformanceAnalysis.Management_TS Thing Shape. For more information, see Dynamic Services in the Mashup Builder section of the ThingWorx Help Center.