Viewing the Event Log
When the currently applied equipment filter is for a site, area, or work center, and the date range filter is 1 month (31 days) or less, you can view a read-only event log showing the loss events for the currently displayed data.
The read-only event log can be viewed from the waterfall, Pareto, and trend charts. The content of the event log is determined by the chart from which the event log is launched, and what within the chart has been selected.
• To view events for all loss reasons in the chart, select nothing in the chart and click View Event Log.
• To view events for a particular loss category or loss reason in the waterfall or Pareto charts, select that bar in the chart and click View Event Log. When the selected blue bar is Unaccounted, the unaccounted time for each production block in the filtered date range is shown. If the date range includes the current date, this includes all unaccounted time through the end of the current production block.

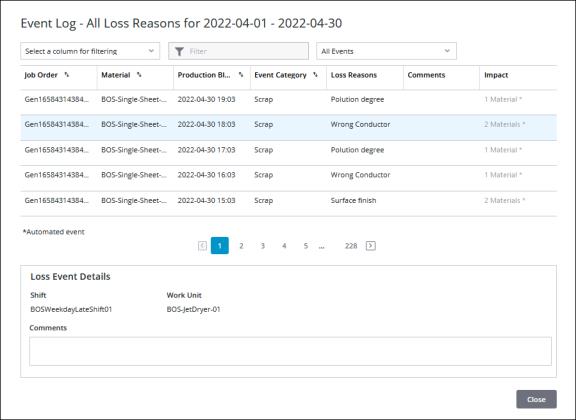
The window title includes the date range being viewed. It also indicates whether the chart is displaying all loss reasons for the date range or a specific loss category or loss reason.
For each event, the following information can be displayed: the job order that was in production, the material that was being produced, the start date and time of the production block, the event category and loss reason for the event, and the event impact in minutes or materials. In the Comments column, the comments icon ( ) displays if there are comments present on the event, and the alert icon (
 ) displays if the reason selected for the event is not at the lowest level of the reason tree.
When you initially open the window, the list of events is sorted by the time of the event, with the most recent event at the top. You can sort the list on the Job Order, Material, Production Block, and Event Category columns.
You can narrow down the list of events by selecting the Job Order, Material, Event Category, or Loss Reason column from the Select a column for filtering drop-down list, and then entering text in the Filter field to filter on the selected column. To return to viewing the full list of events, select the (None) option from the drop-down list. When you are viewing the event log for the Unaccounted Time blue bar, you can filter only on the Job Order and Material columns.
When you are viewing the event log for all events or for blue bars other than Unaccounted Time, you can further control what is displayed in the list by selecting one of the views from the drop-down list:
• All Events—Displays all loss events.
• Alerts Only—Displays only those events with alerts.
• Scrap Only—Displays only loss events with the Scrap loss category.
Select an event in the list to view additional details for the event in the Loss Event Details pane, including the shift when the event occurred, the work unit on which the event occurred, and any comments on the event. If the event log is showing unaccounted time, the work unit is always the pacemaker for the work center on which production was happening.
To move between the pages in the event log, click  or
or  , or click a page number to go to that page.
 or
or  , or click a page number to go to that page.
You can adjust the size of individual columns in the list using drag-and-drop.
Click Close to return to the chart from which you launched the event log.