Adding a Grid Widget to a Mashup
Adding a Grid
1. Drag the Grid widget from the Widgets panel to a container on the canvas.
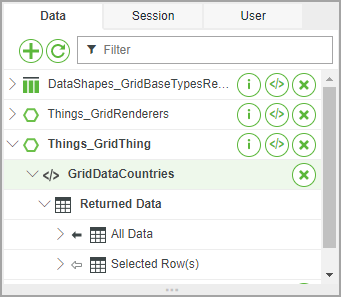
2. On the Data panel, add a data service that returns an infotable.
3. Expand the data service on the panel, then under Returned Data, bind the All Data property of the Data Service to the Data property of the Grid widget. A filled arrow indicates that the infotable is bound to the Grid.

4. On the Properties panel, click  to open the widget configuration dialog box.
 to open the widget configuration dialog box.
5. Configure the Grid columns, then click Done. For more information about the available column configurations, see Configuring Grid Columns.
6. Click Save, and then view the mashup. The data from the service infotable is displayed within the Grid.
Adding a Tree Grid
1. Drag the Grid widget from the Widgets panel to a container on the canvas.
2. On the Data panel, add a data service that returns an infotable that contains the data for the parent nodes on the grid. This data should contain the data that you want to display initially.
3. Expand the data service on the panel, then under Returned Data, bind the All Data property of the Data Service to the Data property of the Grid widget. A filled arrow indicates that the infotable is bound to the Grid.
4. Repeat step 2 to add a second data service that returns an infotable with the child data for the parent nodes. This infotable contains the data to display when a parent is expanded.
When using parent and child data from the same service, bind All Data property of the service to the Data and ChildData properties. |
5. Expand the data service on the panel, then under Returned Data, bind the All Data property of the data service to the ChildData property of the Grid widget.
6. On the Properties panel, configure the following:
◦ Click  to open the widget configuration dialog box. You can hide, reorder, rename, or apply validation to the grid columns
 to open the widget configuration dialog box. You can hide, reorder, rename, or apply validation to the grid columns
◦ Set the IDFieldName property to the name of the infotable column that contains the ID of the child rows.
◦ Set the ParentIDFieldName property to the name of the infotable column that contains the ID of the parent rows.
◦ Set the HasChildrenFieldName property to the name infotable column that specifies whether a row has child data.
7. Bind an event to execute the grid data services at run time.
8. Click Save, and then view the mashup. The data from the service infotable is displayed within the Grid.
Configuring Tree Grid Data
To create a tree grid structure, you must bind infotable data using the following format.
You can connect data and child data to the same or to different sources. You can bind the properties as one infotable to the widget Data property, or bind the parent data to the Data property and the child data to the ChildData property. The following example shows an infotable format for a parent data:
id | continent | hasChildren |
|---|---|---|
1 | Asia | true |
2 | Europe | true |
3 | North America | true |
4 | South America | true |
5 | Antarctica | false |
The following example shows an infotable format for a child data:
id | parentId | continent | country | population | hasChildren |
|---|---|---|---|---|---|
1 | 2 | Germany | 83 million | false | |
2 | 2 | Sweden | 10 million | false | |
3 | 2 | United Kingdom | 67 million | false | |
4 | 2 | Italy | 60 million | false | |
5 | 1 | South Korea | 51 million | false | |
6 | 3 | United States | 331 million | false | |
7 | 3 | Canada | 37 million | false | |
8 | 4 | Brazil | 212 million | false | |
9 | 4 | Peru | 33 million | false | |
10 | 1 | Japan | 126 million | false |
At run time, the child rows displayed when a parent row is expanded.