Service Analytics Dashboards
Service Analytics for ServiceMax Core is an add-on offering. To get access to the Service Analytics package, reach out to the ServiceMax Product team by creating a support case, or reach out to your account managers. Follow the documentation for prerequisites before the installation process.
Service Analytics dashboard helps service leaders know how much it costs the organizations to maintain product quality, view profitability trends, identify business-impacting factors, and identify gaps in their service processes to take necessary corrective steps.
The Service Analytics template provides the following dashboards:
• Cost To Serve: This dashboard provides more visibility into the cost of a service organization to maintain the quality of assets compared to the previous year. It also allows you in-depth visibility into the category, group, and activities where service cost is more and the reason behind it. For more information, see Cost to Serve Dashboard.

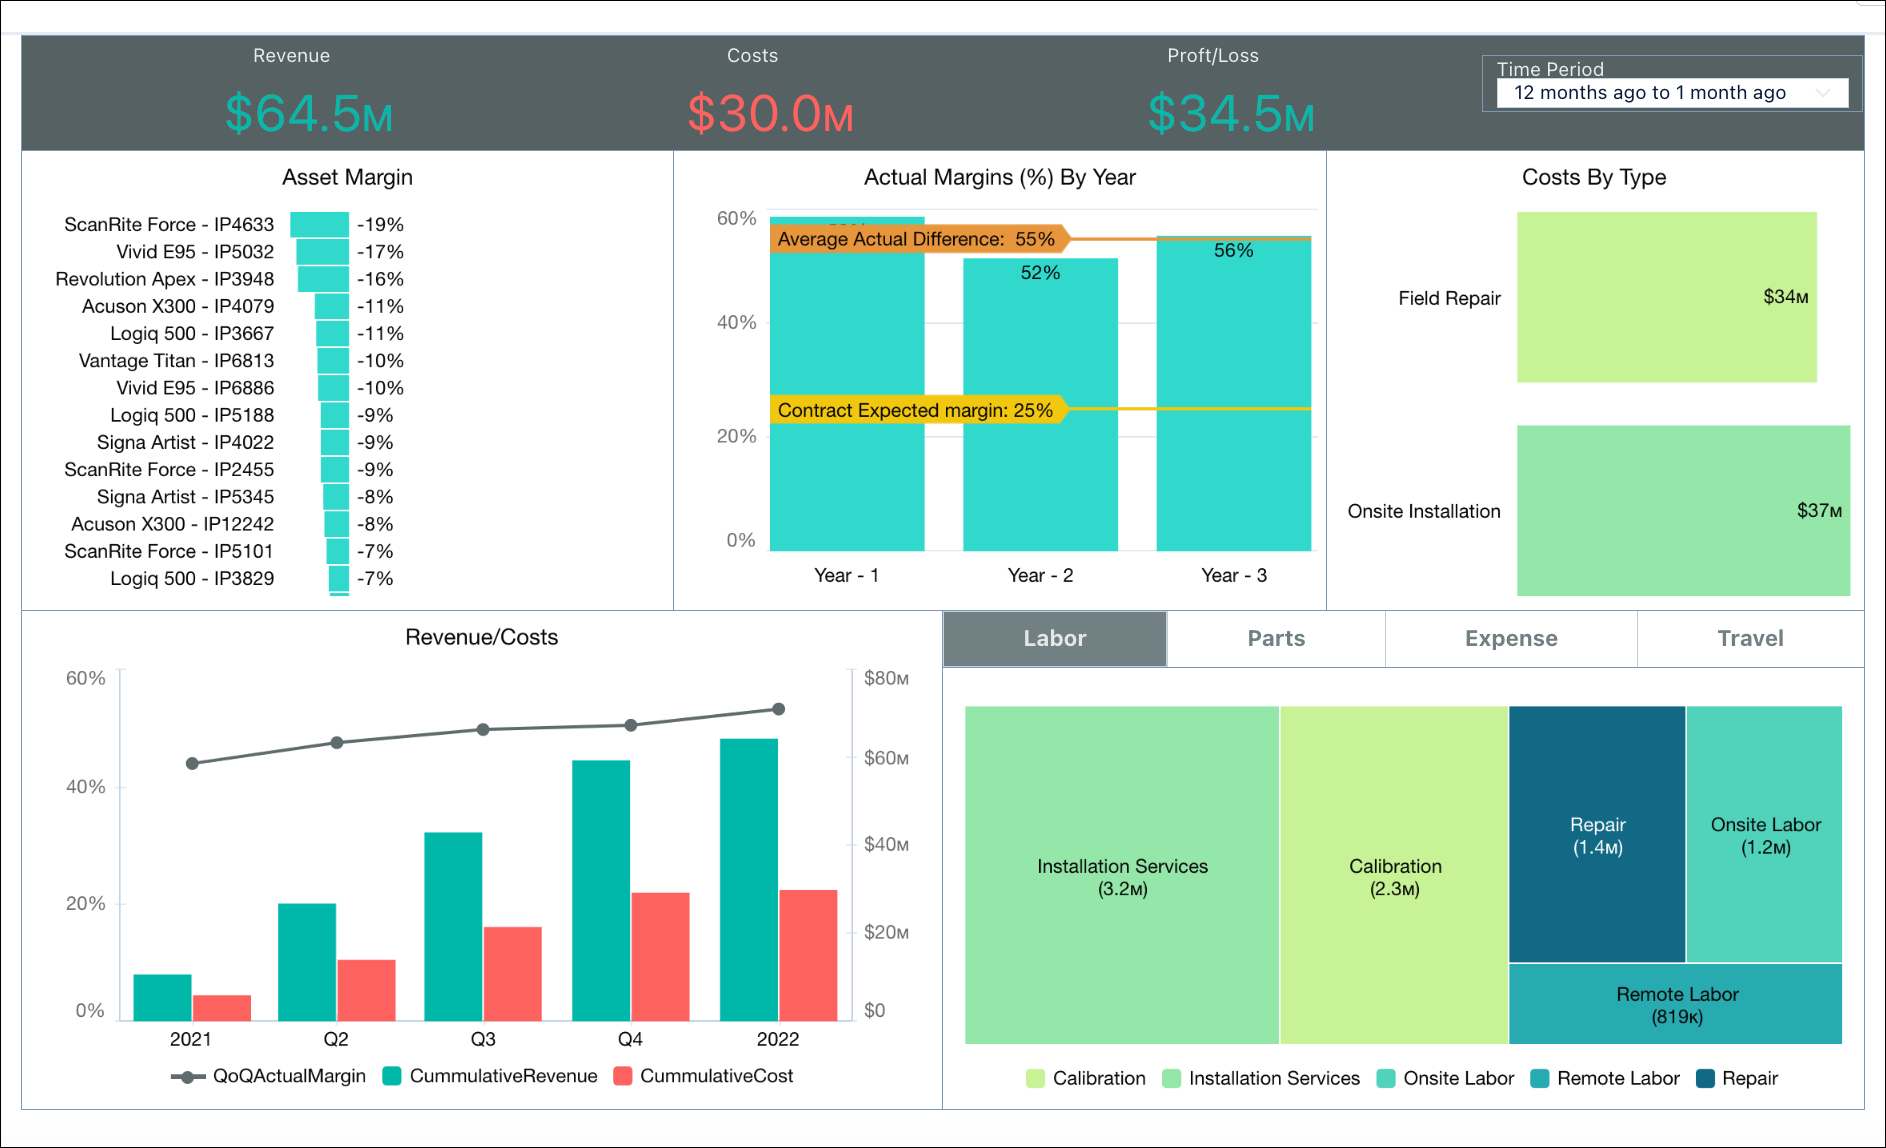
• Service Profitability: This dashboard provides real-time profitability indicators to react, adjust service offerings, and maximize margin revenue. The service profitability dashboard provides overall profitability details and displays month-over-month revenue vs. cost trends for 12 months. For more information, see Service Profitability Dashboard.

• Contract Insights: This dashboard on contract provides insights into the profitability of a service contract at a glance to take corrective steps. For more information, see Contract Insights Dashboard.
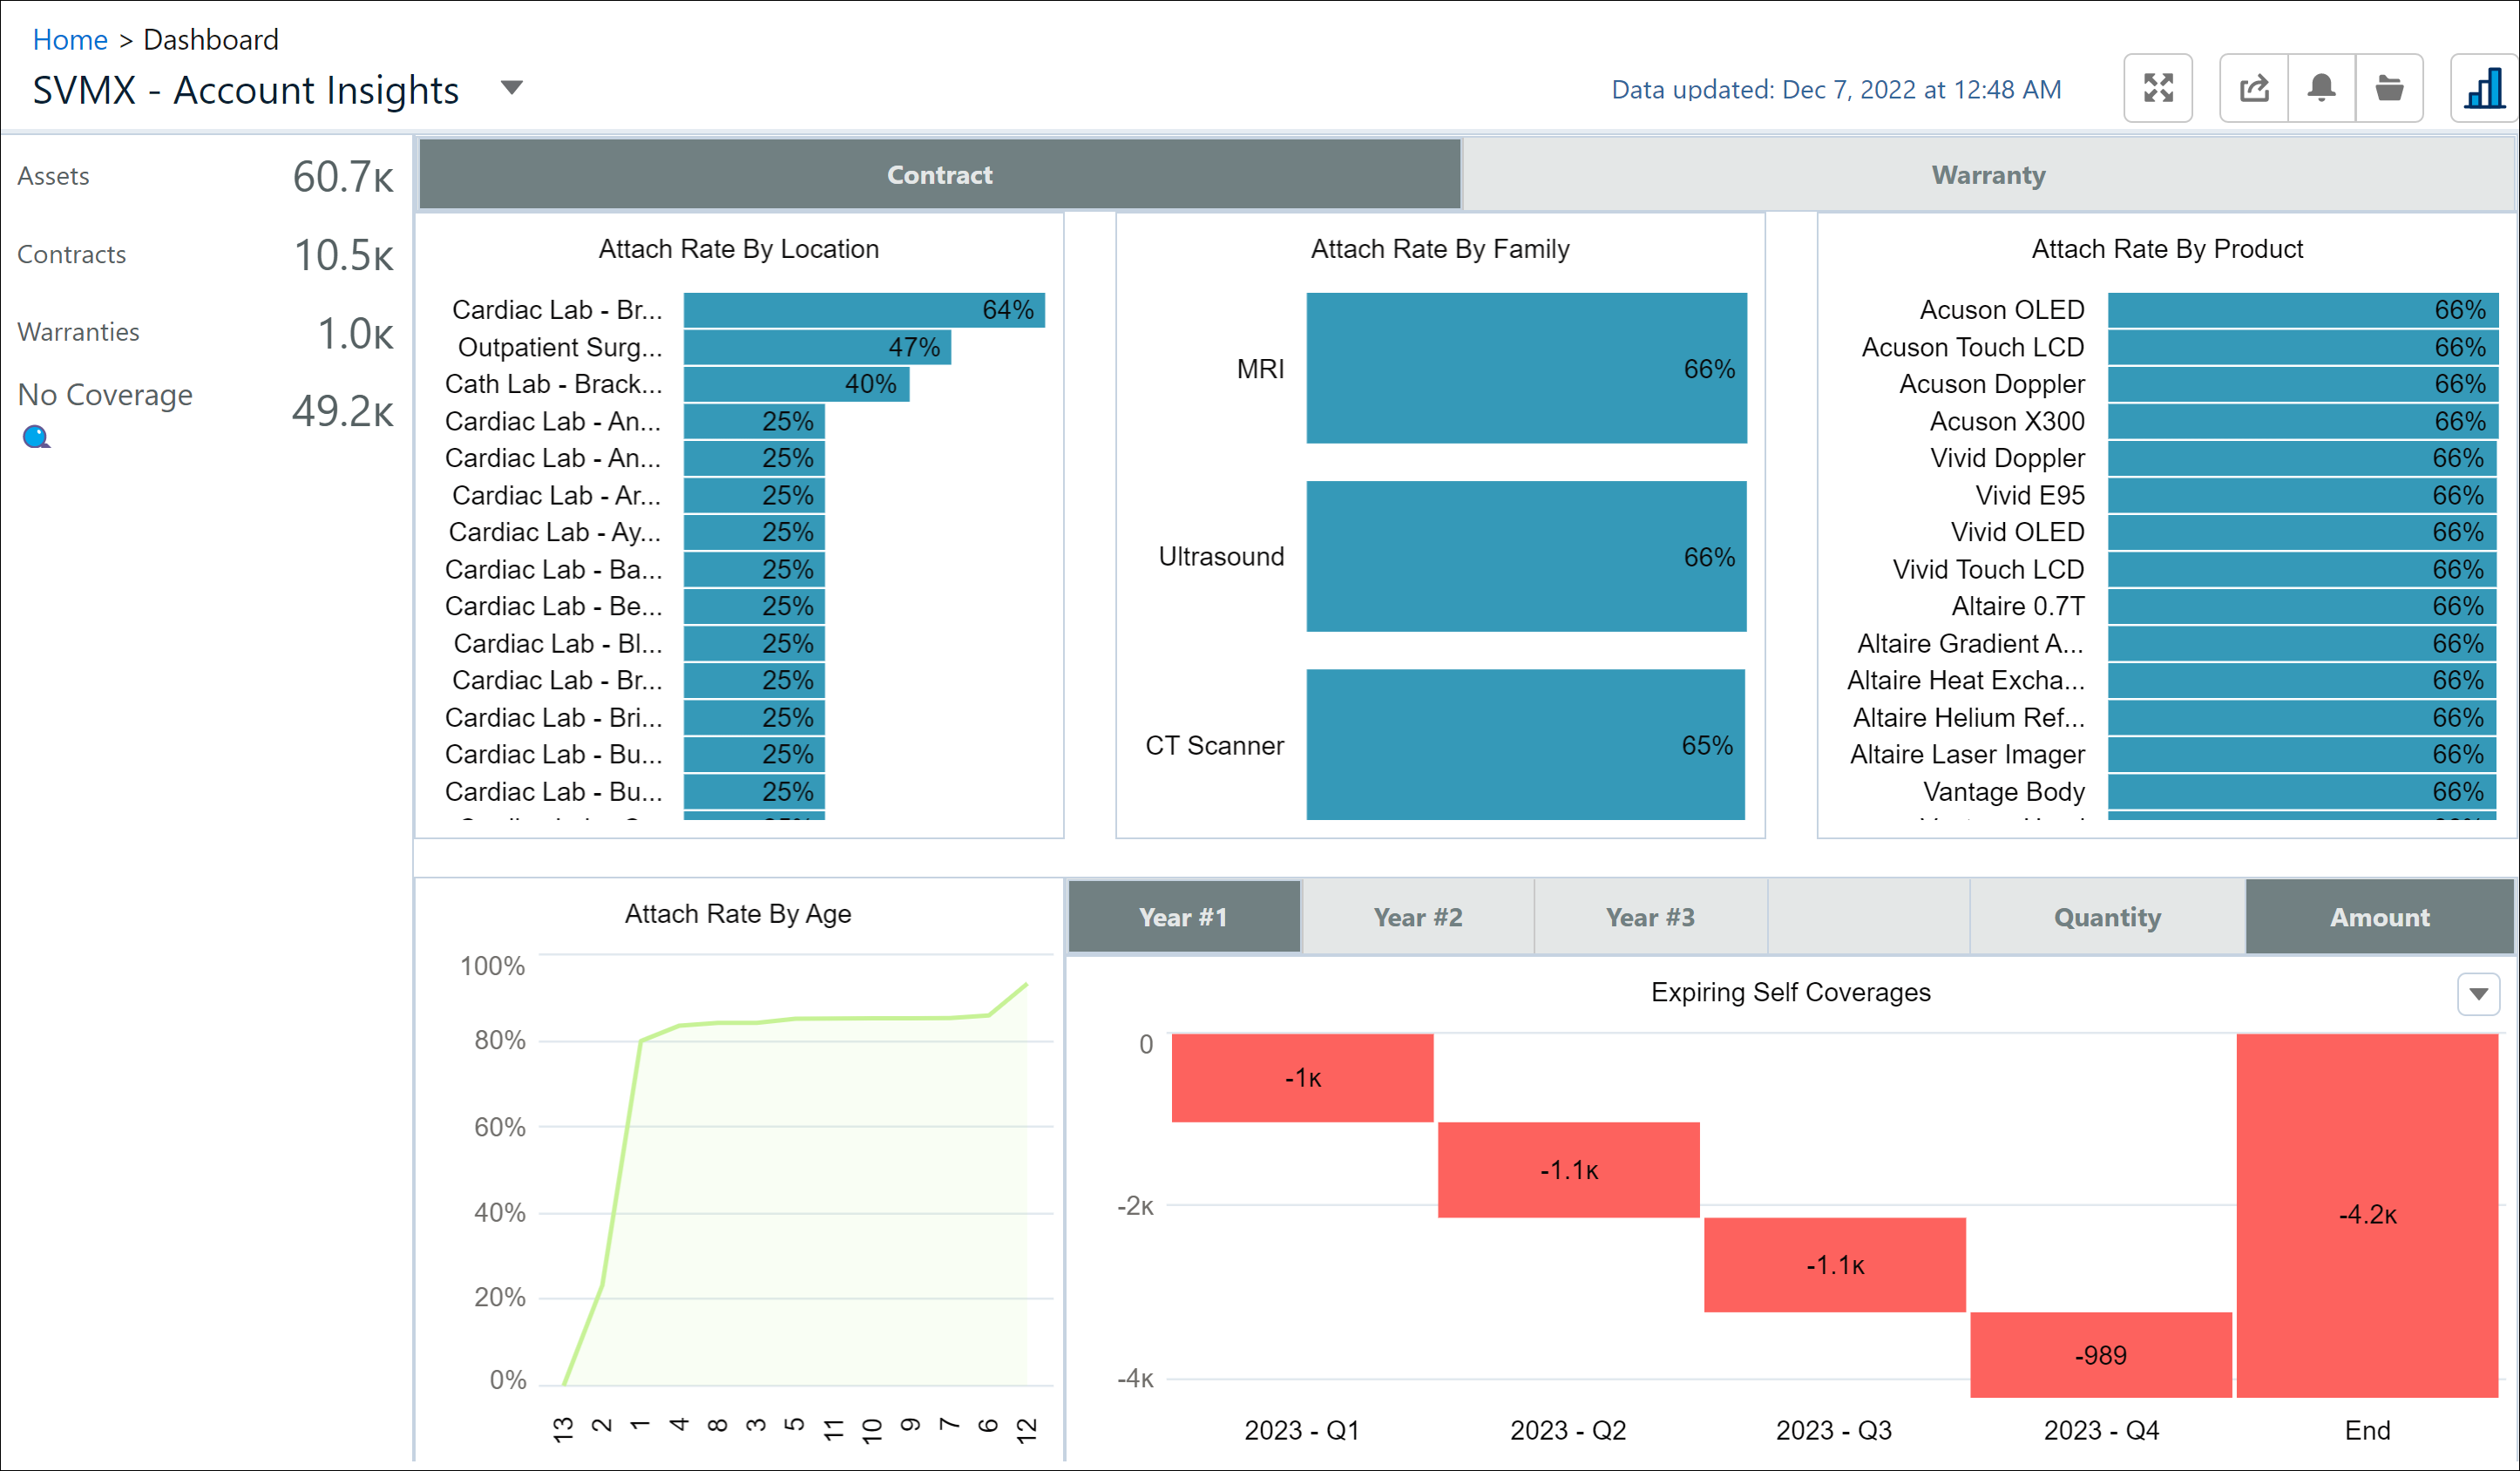
• Account Attach Rate: This dashboard on account provides account insight into how profitable the account is based on revenue generation and sales opportunities. For more information, see Account Attach Rate Dashboard.
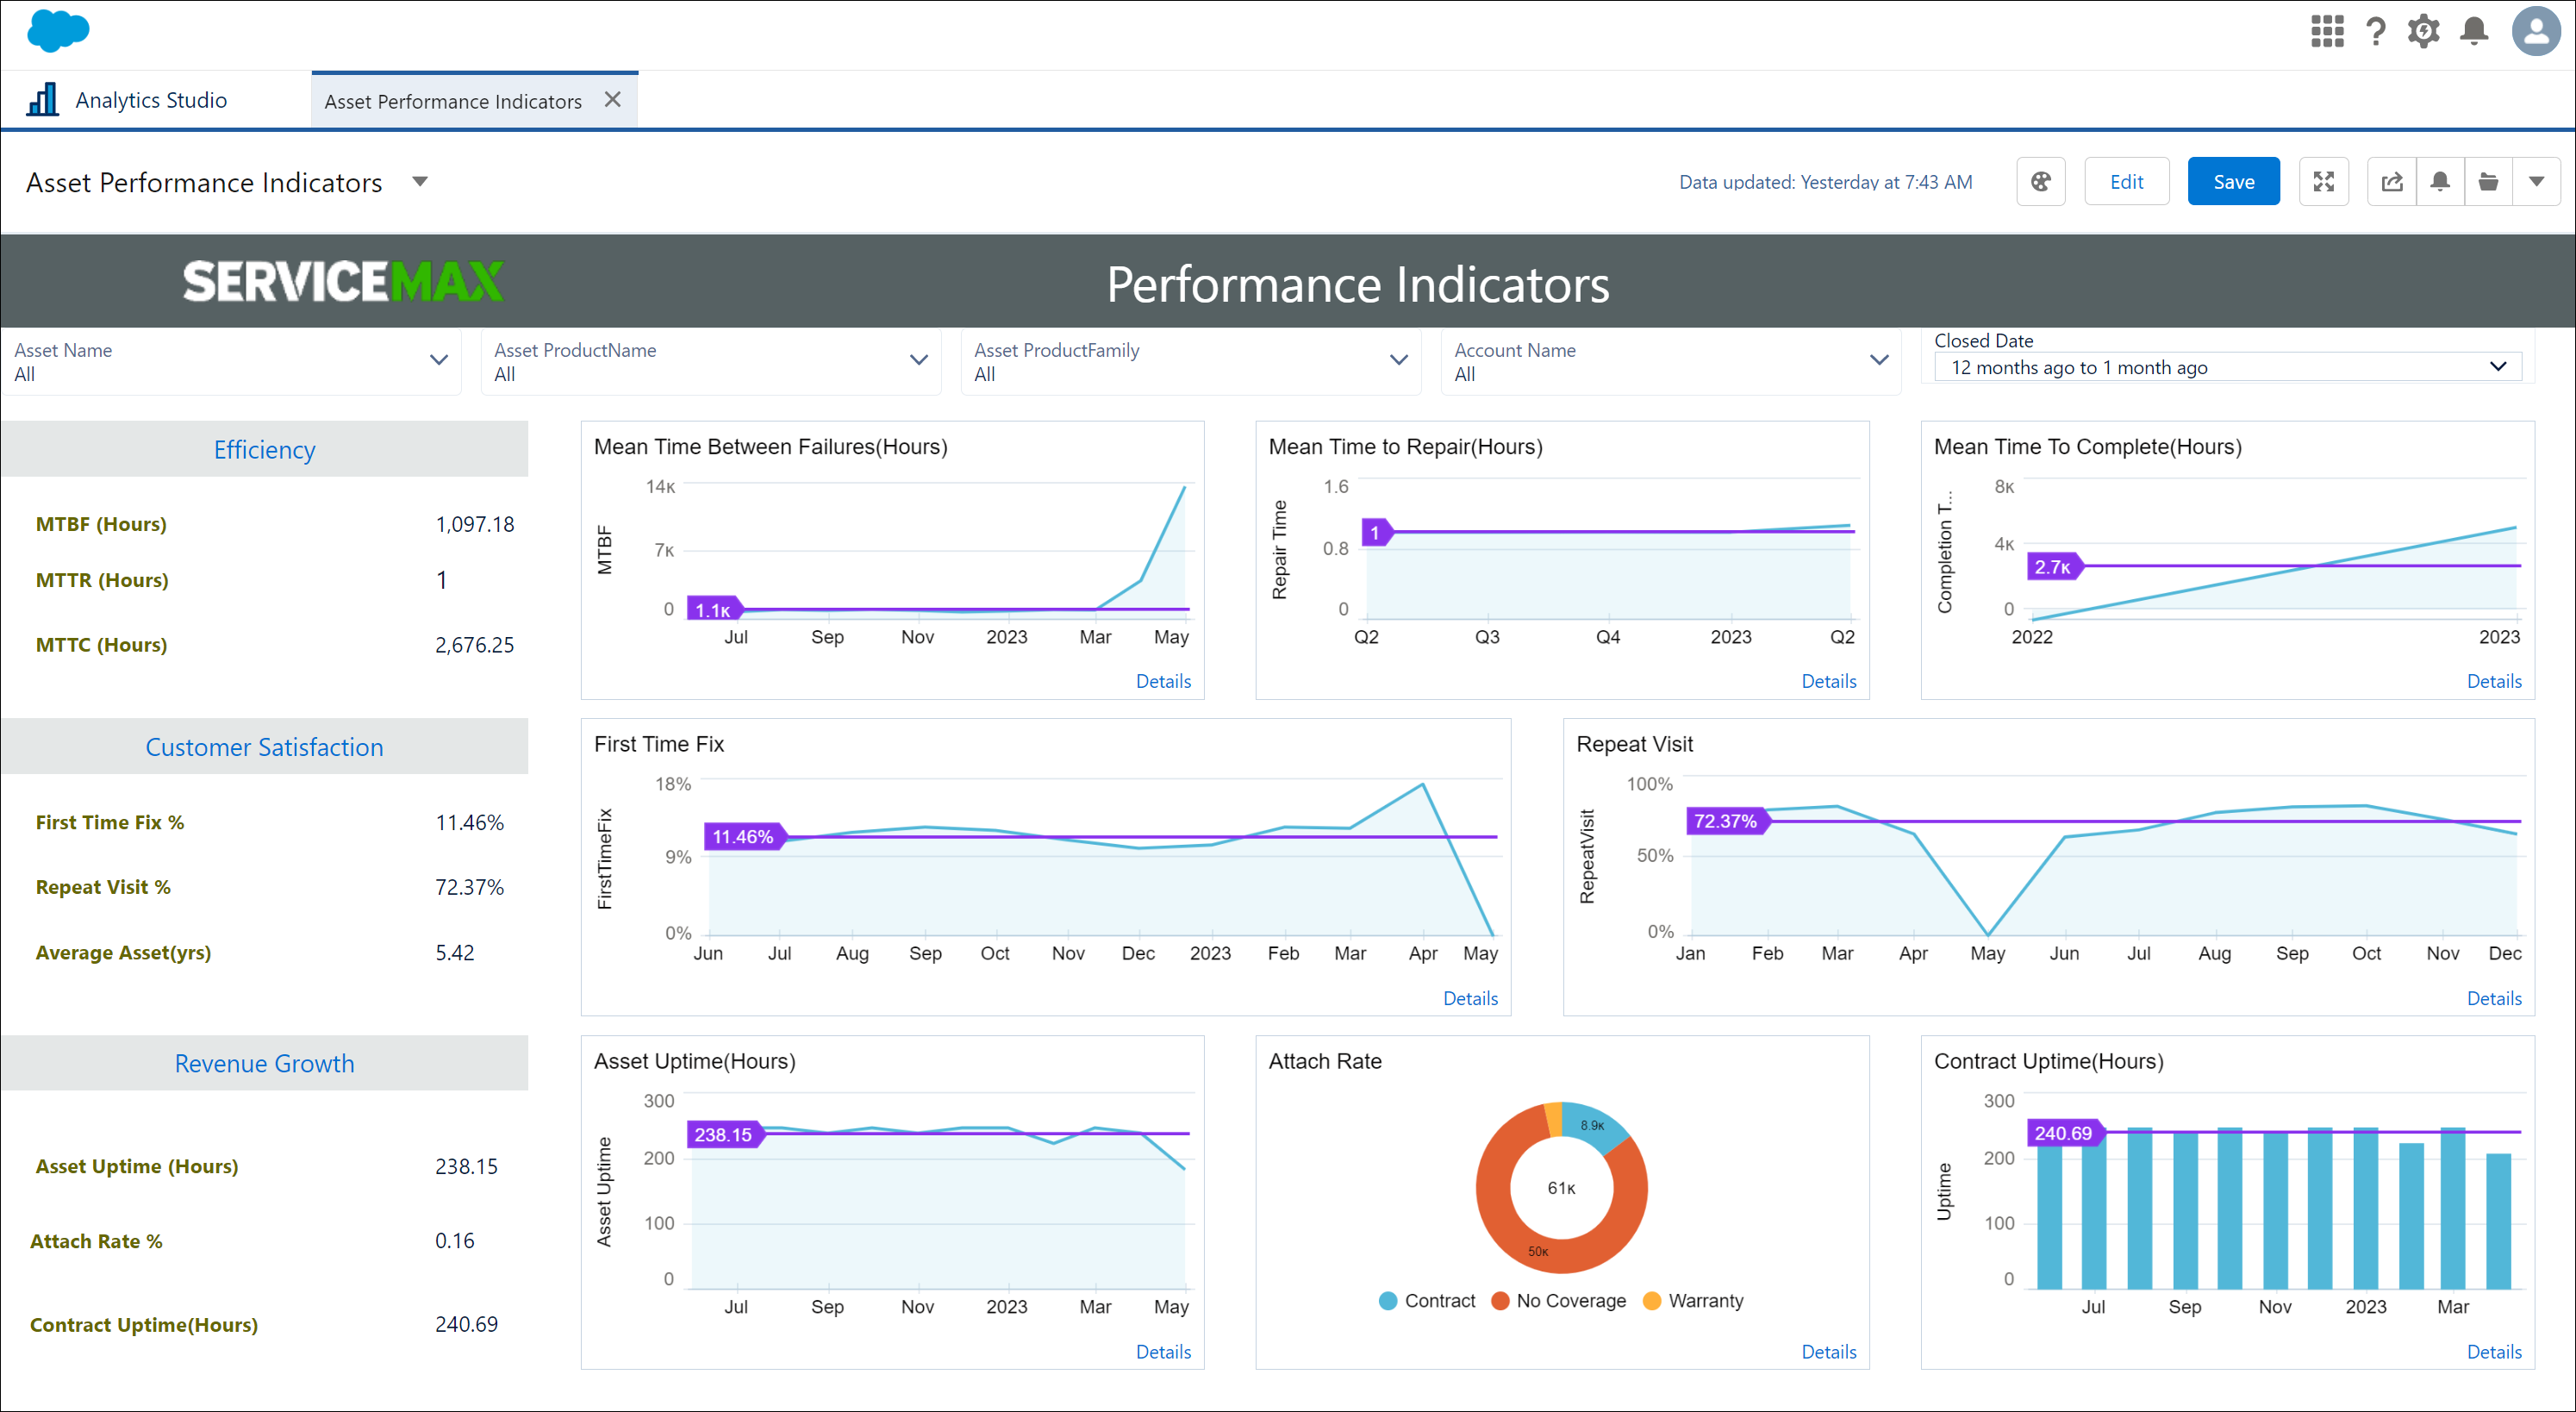
• Asset Performance Indicators: This dashboard monitors KPIs for the assets managed by the organization. For more information, see Asset Performance Indicators Dashboard.
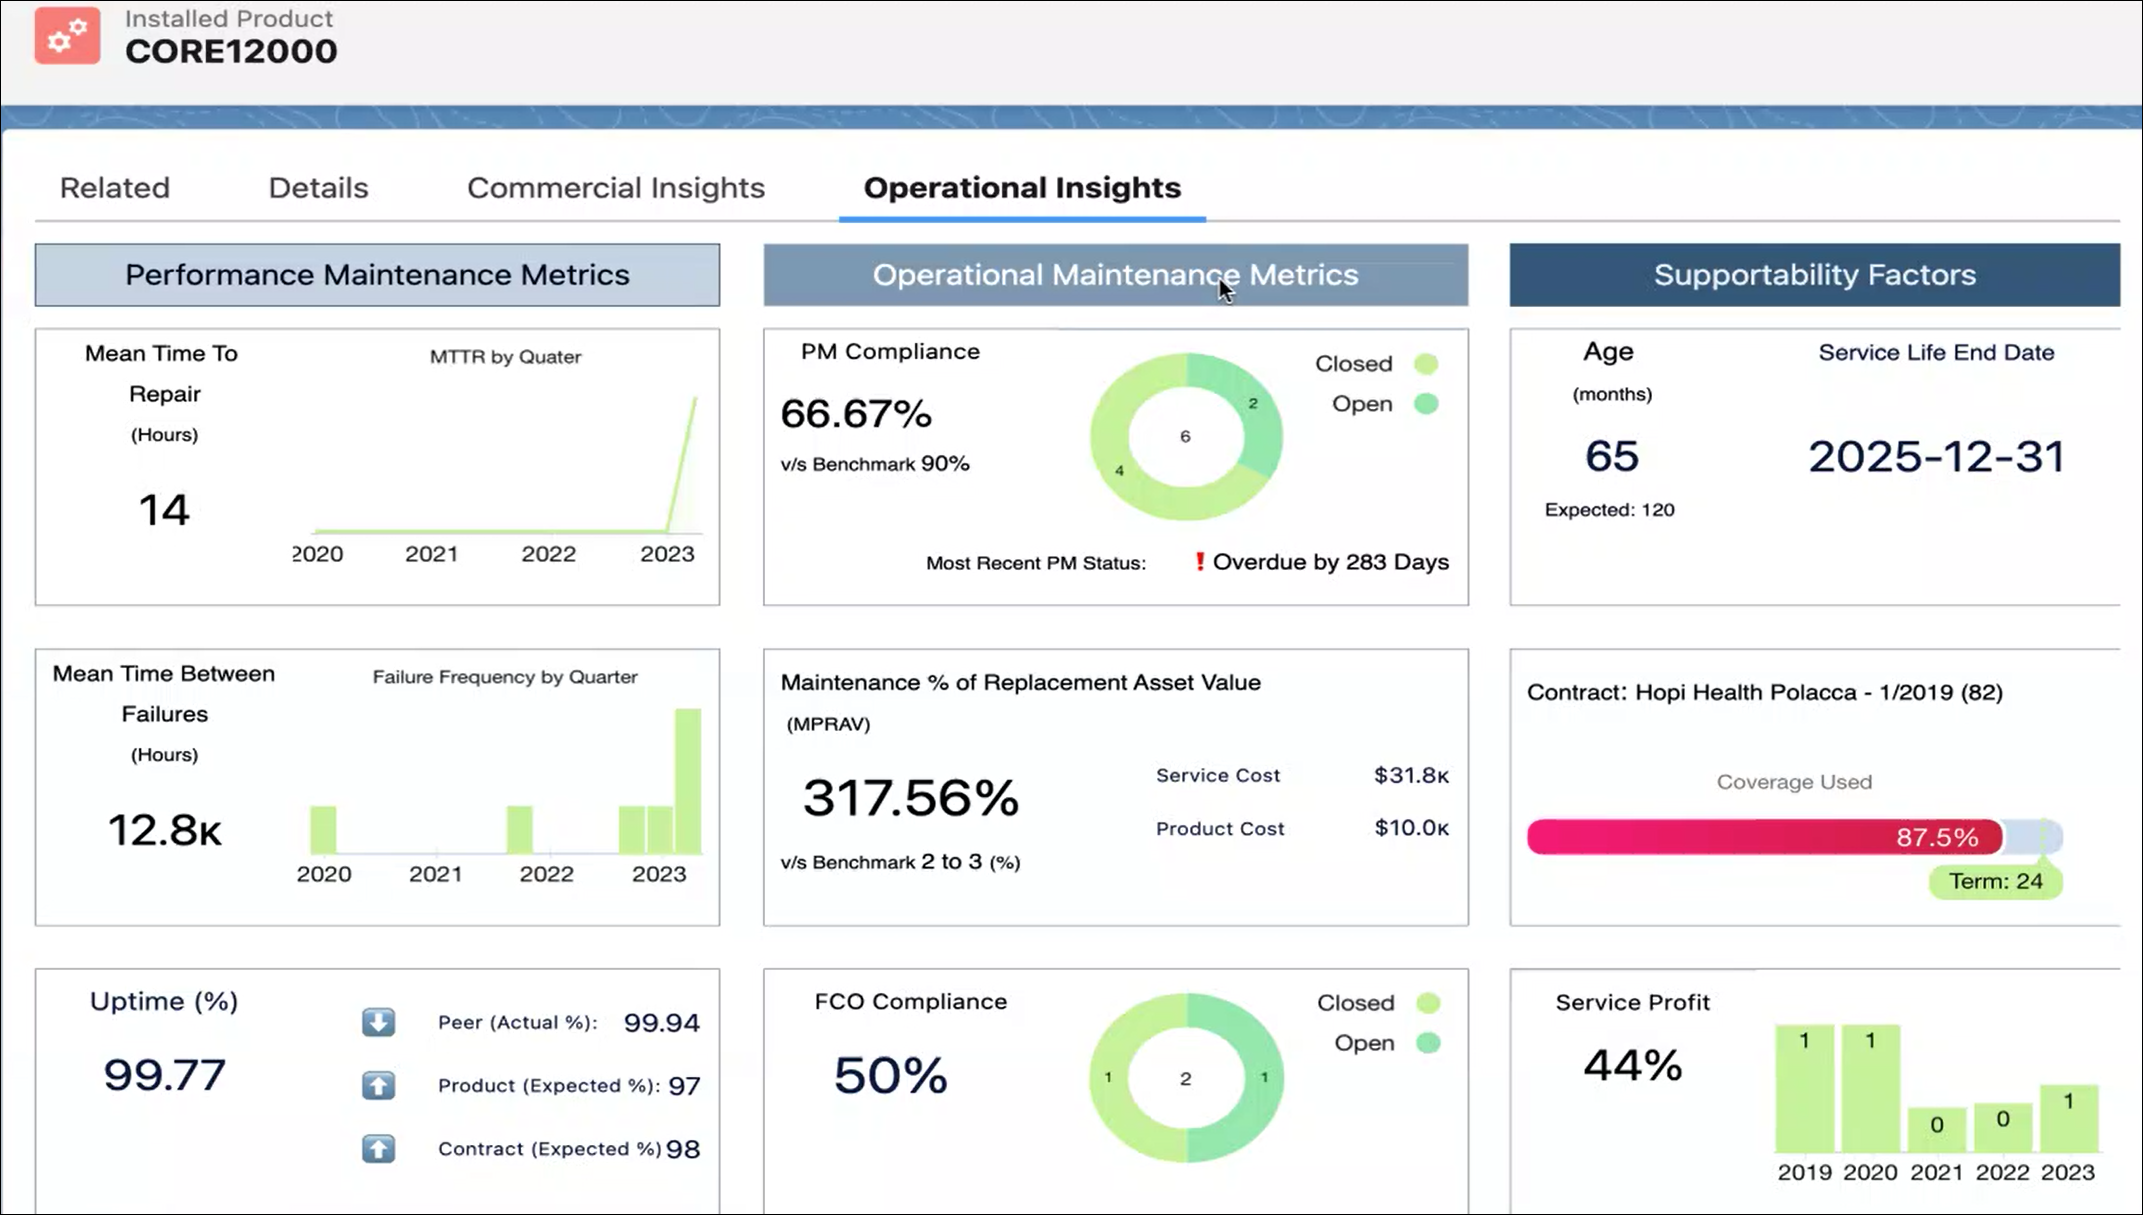
• Operational Insights: This dashboard on the Installed Product record is for the Operations team to get an overview of the performance status, maintenance status, and supportability factors of the installed product. You can know the service quality, maintenance habits, service coverage, and profitability status of an installed product at a glance. For more information, see Operational Insights Dashboard.
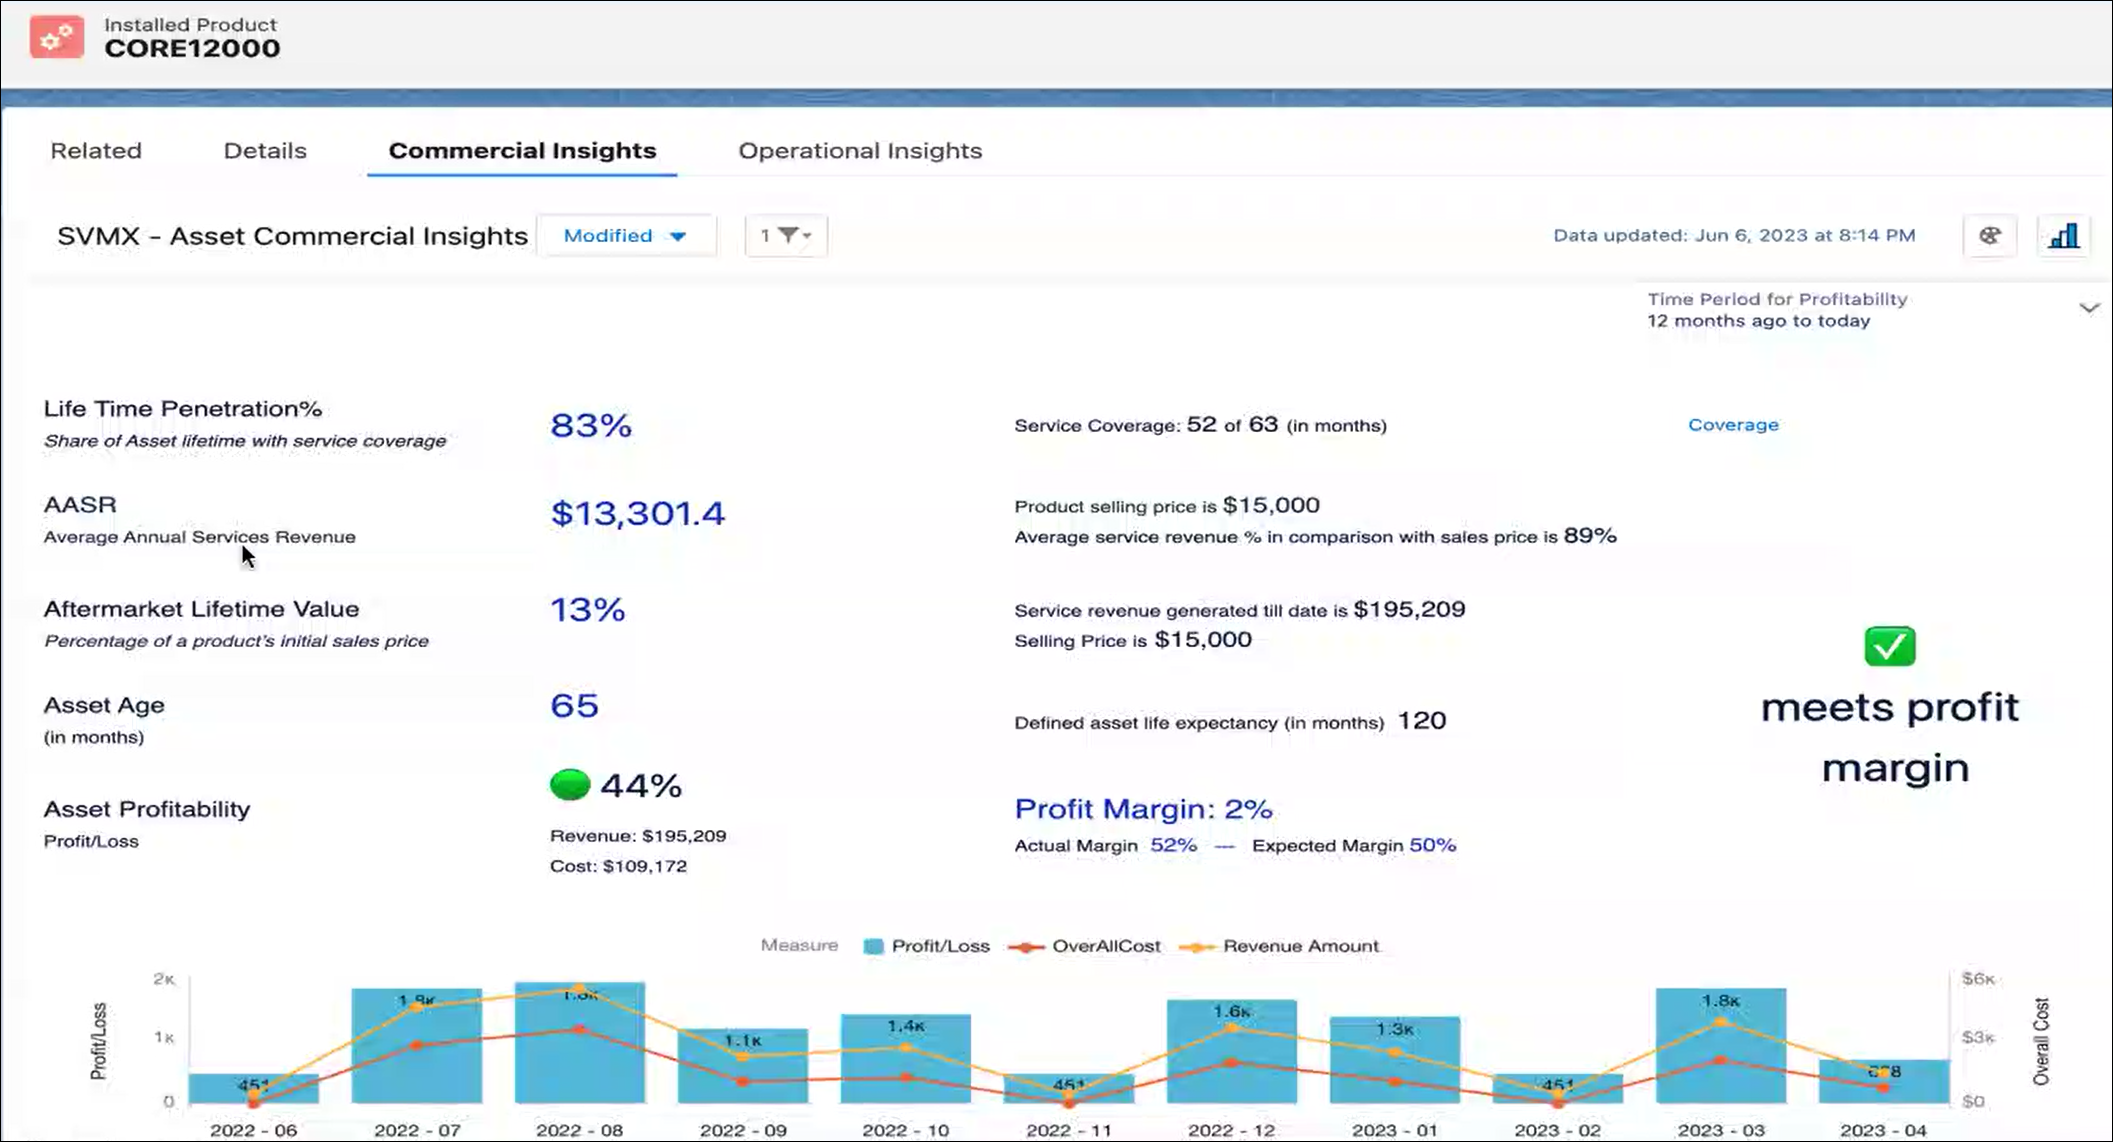
• Commercial Insights: This dashboard on the Installed Product record is for commercial users to know its service coverage percentage, total revenue generation, cost-to-revenue pattern, and more. This information can be used to improve the organization's service coverage, realize the lifetime high or low value to decide on selling more such units, and deep dive to further analyze the cost pattern when margins are low for a longer duration. For more information, see Commercial Insights Dashboard.
Reference Topics
• For information on how to view the dashboards, see Access Dashboards Related to Service Analytics.
• For information on setting up Service Analytics, see Configuring Service Analytics Dashboards.