The Workflow Editor
Use one of the following methods to access the Workflow Editor:
• On the ThingWorx Flow dashboard, click + NEW. In the Create New Workflow window, enter appropriate details, and click Save to open the Workflow Editor.
• If you have a saved workflow, on the ThingWorx Flow dashboard, hover over the section on the workflow tile where you can see the workflow actions to display  . Click the workflow tile to open and edit the workflow in the Workflow Editor.
. Click the workflow tile to open and edit the workflow in the Workflow Editor.Use the Workflow Editor to author, view, edit, configure, and test a workflow.
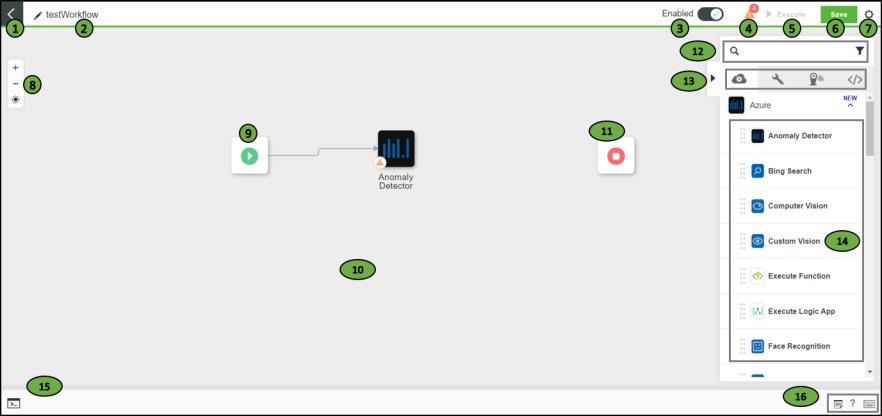
The following table provides a description of the various components of the Workflow Editor:
Legend | Description |
|---|---|
1 | Returns to the ThingWorx Flow Dashboard. |
2 | The name of the workflow. Click  to edit the workflow description and the category that it belongs to. You cannot update the name of the workflow after you save it. to edit the workflow description and the category that it belongs to. You cannot update the name of the workflow after you save it. |
3 | Enables (  ) or disables ( ) or disables ( ) the workflow. You cannot execute the workflow if the workflow is disabled. ) the workflow. You cannot execute the workflow if the workflow is disabled. |
4 | Provides a list of incomplete fields in the actions used in the workflow. Click an item in the list to navigate to the action where you must fix the error. You can execute a workflow only after you configure the fields of all actions correctly. |
5 | Executes the workflow. This is useful for testing the workflow when it is created. |
6 | Saves the workflow. |
7 | Displays workflow settings. For more information, see Workflow Settings. |
8 | From the current view, zoom in or zoom out, or reset the view to the center. |
9 | The start step of the workflow. Configure this step to add a trigger or webhook to execute the workflow from external systems. |
10 | Canvas to create a workflow. |
11 | The end step of the workflow. Configure this step to optionally return data, when the workflow is executed using a webhook. When the workflow is executed via trigger, no data is returned. To save and execute a workflow, there must be at least one complete path between the start and end step. |
12 | Filters the list by action name or predefined category. |
13 | The list of all connectors and actions. Actions are available across the following categories: • Services • Utility • Devices • Custom |
14 | List of actions available for a given connector. You can drag each action from the list onto the canvas. You cannot drag a connector to the canvas. |
15 | Click to view the Debug Panel. This panel displays the results of testing a workflow. |
16 | Click to view a list of the following options: • Notes — Displays a list of all the notes that are added to the workflow. • Help — Provides a walkthrough of creating a workflow in the Workflow Editor and a link to the ThingWorx Help Center. • Keyboard Shortcuts — Displays a list of keyboard shortcuts to use while creating a workflow. |
Debug Panel
When you execute a workflow, you can view the results in the Debug Panel. In the lower-left of the Workflow Editor, click  to open the Debug Panel.
to open the Debug Panel.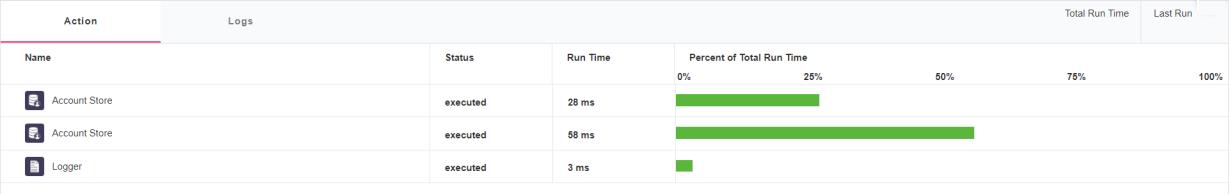
The Debug Panel provides the following details:
• The Action tab provides the name of each action that was executed in the workflow, its status, and time required for its execution. It also displays a progress bar that provides a percent of the total time required for every action in the workflow to be executed.
• On the Action tab, click the action name to display the Input, Output and Logs of every action. When  appears next to an action, it indicates that the execution of the action failed. Click the action name to view the error log on the Errors tab.
appears next to an action, it indicates that the execution of the action failed. Click the action name to view the error log on the Errors tab.• The Logs tab provides detailed console and error logs, if any.
• The upper-right of the Debug Panel displays the Total Run Time and the Last Run details of the workflow.