Working with Profiles
Overview
Profiles help to find patterns and scenarios within your data and provide performance information based on a selected goal. The generated profiles represent distinct subpopulations in the data that exhibit different behaviors with respect to the selected goal. This type of information is typically used to focus on the margins of the dataset, to identify populations that are over- or under-performing relative to the goal (high or low outcome records).
Each profile includes a set of features and values that define a distinct subpopulation. Profiles are mutually exclusive, so each record can be included in only one profile. Profiles are displayed in a table with groups of rows that represent numbered profiles.
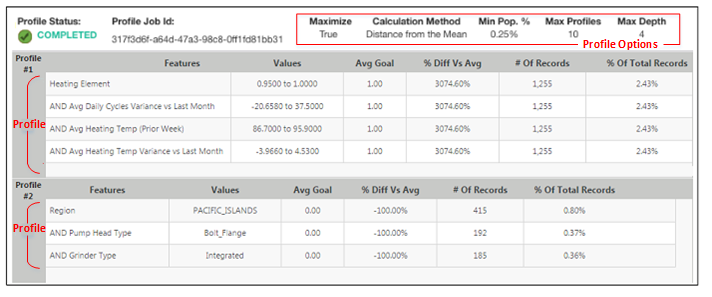
In the Profiles table, each profile is numbered on the left. The total number of profiles will not exceed the value entered in the Max Profiles option when the profile is generated. Within each profile subtable, the rows represent the combination of features that has been identified as a profile. The number of rows will not exceed the value entered in the Max Depth option. The columns in each profile show information about the features that make up the profile, such as the specific feature value identified as part of the profile, how it compares to the overall goal value, and what percentage of the overall records include the identified feature value.
|
|
The binning functionality that defines the value range in the Values column is non-inclusive. It can be represented mathematically as (x to y]. For example, if a bin is defined with a range of (15 to 17], values will be captured only if they are > 15 and < = 17. In this example, values of 15 will not be captured, but 15.0001 will be captured.
|
Two Methods for Working with Profiles
Analytics Builder provides two ways to create and view profiles, each of which is described in the subsections below:
• View from the Profiles List Page – The Profiles list page provides a list of all existing sets of profiles for every available dataset.
• View Profiles from the Model Results – If a set of profiles is based on a specific model, you can view the profiles directly from the results page of the model.
When generating new profiles, the process can be launched from the Profiles List page or from a Model Results page. The difference is one of convenience vs. flexibility. When a set of profiles is based on a specific model, the dataset and any filters or exclusions are already defined. When profiles are generated from the list page, all of that information needs to be provided. However, generating from the list page offers a degree of flexibility, for adding data and filtering, that is not available when generating from a model.
View from the Profiles List Page
The Profiles list page contains two sections. At the top, a table lists all of the existing sets of profiles that have been created. When you select one of the profile rows, the selected set of profiles are displayed in the bottom section of the page.
The Profiles list at the top of the page includes the following columns of information about each set of profiles:
Column Name | Description |
|---|---|
Profile Name | The name of a profile. The name will be user-defined if the profile was created from the Profiles page. If the profile was created from a Model results page, the name will be auto-generated. |
State | The current status of the profiles job. When you first generate profiles, the state is "Queued" and then "Running." When the profile is generated and ready for use, the state changes to "Completed." If the job fails, the state will show "Failed." |
Dataset | The name of the dataset the profile is based on. |
Filter | A filter that was applied to the dataset when the profile was generated. |
Goal | The goal variable selected for generating profiles from the dataset. |
Max Depth | The maximum number of features each profile can include. |
Min Population % | A threshold that indicates what percentage of the population must exhibit a given attribute for a profile to be identified. |
Maximize | Indicates whether or not the profile identified features that would maximize the goal outcome. |
Max Profile Count | The maximum number of profiles that could be identified in the dataset. |
Calculation Method | The method used to select sub-populations to include in a profile. The default option is Z Scores (distance from the mean, adjusted for sub-population size) which is more likely to find larger sub-populations that are statistically distinct. The other option is Distance from Mean (not adjusted for sub-population size) which is more likely to find smaller sub-populations of outliers. |
Job ID | An automatically-assigned identifier for the profile generation job. |
Start Time | The date and time the profile job was started. |
The profiles list page contains several options for creating new profiles and working with existing profiles in the list table:
• New – Opens the New Profile dialog box. Follow the steps in Generate New Profiles without a Model.
• Delete – Removes the selected profile.
• Job Details – Displays run time information for the profiles job.
• Refresh – Refreshes the information on the Profiles list page
• Filter Definition – Opens a Filter Definition dialog box and displays the conditions defined for the filter applied to the dataset when the profile was generated.
• Exclusions – Opens a Feature Exclusions dialog box and displays a list of any features that were excluded from the dataset when the profile was generated.
• Prev/Next – Pages back or forward through the list of profiles when the list is too long to display all at once.
To filter the list of profiles displayed in the list table, click Add Filter and select from the list of columns (example: "Goals"). Then identify the conditions for filtering the column (example: Contains "Pump"). Click Save (only profiles with "Pump" included in the Goals column will be displayed).
View Profiles from the Model Results
To view Profiles for a specific model:
1. On the Models list page, find and select the model for which you want to view profiles.
2. Click the View button.
The Model Results page opens.
3. On the left, under the Model Results heading, click Profiles.
One of the following will happen:
◦ If you have previously viewed or generated profiles for the selected model, the Profiles page will open and display a table of profiles.
◦ If this is the first time you have opened the Profiles page for the selected model, the profiles do not yet exist and a dialog box is displayed to prompt you to create them. Click Yes. An initial set of profiles will be generated.
When the Profiles page is displayed, in addition to the profiles table, it includes options to do the following:
◦ Generate New Profiles — Change the profile options and generate a new set of profiles for the dataset. For more information, see Generate New Profiles Based on a Model.