Managing Data Selection in a Chart
You can use selection to highlight specific data points in a chart visualization using widgets such as Grid, Value Display, or other types of charts.
The SelectionMode property lets you control how users can select data points on the chart. You can choose from the following list of options:
• Default
• Single
• Multiple
|
|
To disable zoom when selecting items directly on the chart, set the selection mode to single or multiple.
|
Default Selection Mode
Selection is used for zoom. You can select two data points on the chart to inspect a specific data range more closely.
Single Selection Mode
Select one data point at a time. When single selection mode is active, zoom using direct selection or mouse clicks is disabled.

Multiple Selection Mode
Select multiple data points by clicking the left mouse button or pressing the SPACEBAR key. To select all visible data points on a chart in multiple selection mode, click Select All. When one or more element is selected, you can clear the selection by clicking theClear All label.

Passing Selected Data to Another Widget or a Data Service
To pass data selections on the chart to another widget, data service, or function, use one of the following properties:
• SelectedData—An infotable property for the chart widget on the Properties panel.
• SelectedRows—An infotable property for the data service on the Data panel.
Both properties have an out binding, and you cannot use them to preselect data on charts. |
When working with chart selections, you can pass each selected data point using the SelectedData infotable. Use the SelectedRows property of the data service to retrieve the selected rows within the data service infotable. This property preserves the original format of the data source. However, when you select a data point, the corresponding row that it belongs to is selected. To pass a specific value for selected data points on the chart, use the SelectedData infotable property. Each selection is a row that shows additional details about the selected data point.
The infotable of the SelectedData property is formatted using the following Data Shape:
Field Name | Description |
|---|---|
x | The X-axis value in a string format |
y | The Y-axis value in a string format |
xType | The base type of the X-axis |
yType | The base type of the Y-axis |
xAxisField | The field name of the X-axis value in the data infotable |
dataField | The field name of the Y-axis value in the data infotable |
dataLabel | The label of the selected data point in the legend |
The following figure shows a Bar Chart with multiple selections. The SelectedData property of the chart is bound to a grid and two bars are selected from each category on the X-axis.
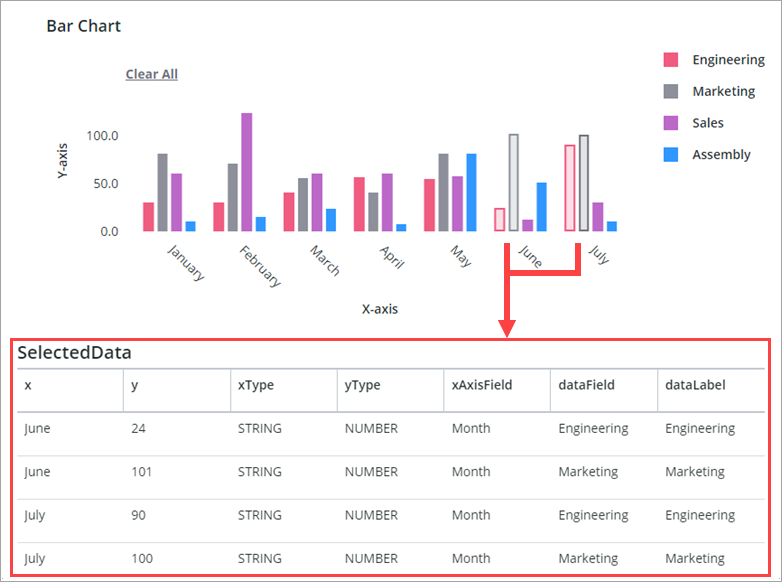
The SelectedData infotable is displayed using a Grid widget. Each selection is listed individually and only data related to the selected column is displayed. You can use the infotable content to pass information to a data service, function, or widget.
The following figure shows the previous chart with two selected data columns.
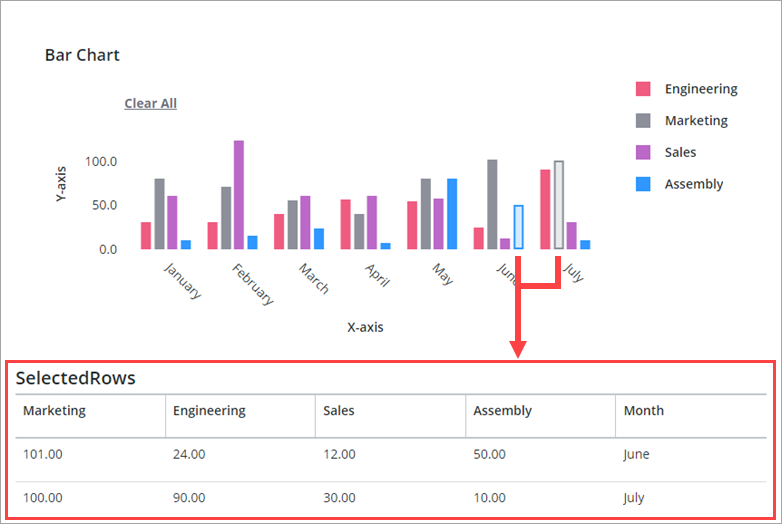
The SelectedRows data service property is bound to the Data property of a Grid widget. When a chart column is selected, its corresponding row in the infotable data source is selected. In this example, each row is a month with measurements for four different teams. Each team is displayed as separate data series. You can pass the selected rows to a data service or a widget. To pass specific values from one series only, use the SelectedData property.
Working with Chart Events
All chart widgets trigger events when a user selects items on a chart. You can use events to pass the selected rows or data points in the infotable. Bind the following events to trigger services within entities, functions, or other widgets:
• SelectedRowChanged—A data service event on the Data Properties panel. This event is triggered when a user clicks a bar or a column and the selected infotable row changes.
• SeriesClicked—A widget event on the Properties panel. The event is triggered when any data series on the chart is clicked.
Disabling Data Selection
You can disable data selection for specific bars or columns in the Pareto and Waterfall Chart widgets. To disable data in one of these charts, perform the following steps.
1. In Composer, configure the chart data service:
◦ Add a selectable field name to the chart Data Shape entity.
◦ Add the field name from the Data Shape to the chart data service.
◦ Edit the data service to include data for the column.
2. In Mashup Builder, select a Pareto or Waterfall chart, and then open the Properties panel.
3. Select the check box of the NonSelectableData property.
4. Click Save, then view the mashup.
True or False values under the Selectable infotable column are used to determine whether the data row is selectable at run time.