Adding Reference Lines to a Chart
Reference lines are vertical or horizontal markers that enable you to compare data to a reference value on a chart. Reference lines are dotted lines that are set relative to a specific value on an axis. The lines add additional context by visualizing the chart data relative to one or more constant values such as:
• a performance metric or a threshold
• a minimum or a maximum
• an average
|
|
You cannot display reference lines on charts with a secondary Y-axis.
|
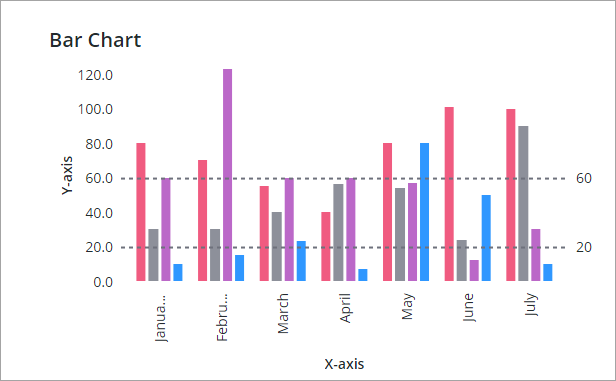
You can set the value of reference lines using the ReferenceLineNValue property. To display reference lines based on dynamic values on a chart, bind a parameter from a data service to the property. The following figure shows a Bar Chart widget with two reference lines on the Y-axis.
You can display reference lines on the X or the Y axis, depending on the chart type and the axis data type. Reference lines can only be displayed on continuous types of data, such as numeric or date values. You can display reference lines on the following chart widgets:
• Bar Chart
• Line Chart
• Waterfall Chart
• Schedule Chart
The Pareto chart supports reference lines only for the threshold value. |
To add reference lines to a chart:
1. Select a standard chart widget on the canvas or use the Explorer panel. The widget properties are listed on the Properties panel.
2. On the Properties panel, use the NumberofReferenceLines property to specify the number of reference lines to display on the chart. You can add up to 24 lines. Additional configuration properties are displayed for each reference line.
3. Configure each reference line on the chart using the following properties:
◦ ReferecneLineNLabel—Enter a label to display a label next to reference line on the chart.
◦ ReferecneLineNValue—Sets the data value of the reference line.
◦ ReferenceLineNAxis—Specifies the chart axis to display the line. This property appears only when a chart has two axes with continuous data.
4. Click Save to save your changes to the widget on the mashup.
The following table lists properties that are used to configure reference lines on supported charts:
Property Name | Description | Base Type | Default Value | Bindable | Localizable |
|---|---|---|---|---|---|
NumberOfReferenceLines | Specifies the number of reference lines to display on the chart. You can add up to 24 reference lines. Additional properties are added for each reference line. | NUMBER | 0 | Y | N |
ReferecneLineNLabel | Sets the text label of the reference line. | STRING | N/A | Y | Y |
ReferecneLineNValue | Sets the value of the reference line. You can specify a numeric or a date value based on the axis type. The reference line is not displayed when you specify a value that is outside the data range of the chart. | NUMBER or DATETIME | 0 | Y | N |
ReferenceLineNAxis | Specifies the axis to use for the reference line. This property is available only when a chart contains two axes with continuous data, such as numbers or dates. Specifies the axis used to display reference line N. | STRING | X-axis | N | N |
Some reference lines that are displayed in proximity are automatically hidden when their labels collide at run time. Hidden lines are displayed when the chart is zoomed in or when enough spacing is available to display both labels after the data range changes. |
When two reference lines are displayed in close proximity, and the line labels collide, then one of the threshold labels is hidden. The label is displayed only when the chart is zoomed or the data range changes with enough spacing to render both labels.
Adding Vertical Reference Lines to a Chart
You can display reference lines horizontally or vertically using the ReferenceLineNAxis property on the widget Properties panel. The following figure shows a Line Chart widget that is set to scatter plot type.
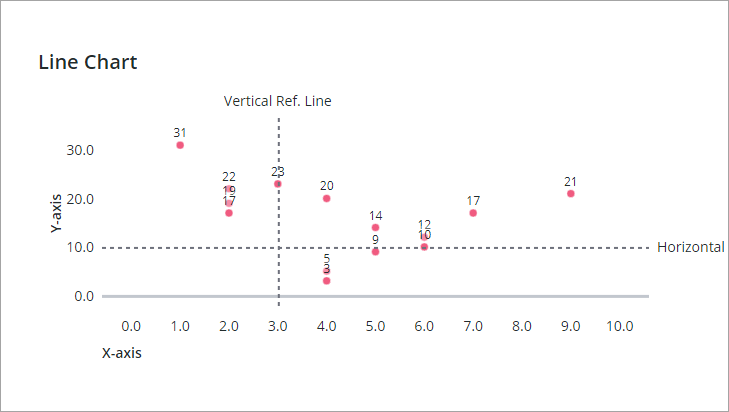
In this example, the scatter plot chart has two axes with numeric values, and you can display each reference line on the X-axis or the Y-axis.