Anomaly Detector
Azure Anomaly Detector lets you integrate anomaly detection capabilities into your applications, so that users can identify problems before they occur. For more information, see Azure Anomaly Detector.
Use the Anomaly Detector action to detect anomalies in your time-series data.
Complete the following steps to use the Anomaly Detector action in your workflow:
1. Drag the Anomaly Detector action under Azure to the canvas, place the pointer on the action, and then click  or double-click the action. The Anomaly Detector window opens.
or double-click the action. The Anomaly Detector window opens.2. Edit the Label, if needed. By default, the label name is the same as the action name.
3. To add an Azure connector type, refer to Supported Azure Connector Types.
If you previously added a connector type, select the appropriate Connector Type, and under Connector Name, select the connector.
4. Click TEST to validate the connector.
5. Click MAP CONNECTOR to execute the action using a connector that is different from the one that you are using to populate the input fields. In the Runtime Connector field, provide a valid Azure connector name. For more information about MAP CONNECTOR, see Using Map Connector.
If you selected Connector Type as None, the MAP CONNECTOR option is not available.
6. In the Resource Group list, select the appropriate resource group defined under your Azure subscription.
7. In the Anomaly Detector Account list, select the Anomaly Detector account.
8. In the Detection Type list, select one of the following options:
◦ Entire Series—Detect anomalies for the entire series of data.
◦ Latest Point—Detect anomalies for the last data point only.
9. In the Series field, map the output of a previous action to provide an array of time-series data points. This time-series data must be sorted by timestamp in ascending order. You can have only one value per timestamp. Provide a minimum of 12 data points and a maximum of 8640 data points.
10. In the Granularity list, select one of the following options:
◦ Daily
◦ Hourly
◦ Minutely
◦ Monthly
◦ Weekly
◦ Yearly
Ensure that you select the correct option, as it indicates the time difference between each data point, and it is used to verify whether the time series is valid.
11. Click Show additional fields.
12. In the Sensitivity field, enter a value between 0 and 99. Specify a lower value to ensure that fewer anomalies are accepted.
This field is optional.
13. In the Custom Interval field, enter the time interval at which the data points of the time-series are separated.
For example, if the data points of the time-series are separated by 2 days, then set Granularity to Daily and Custom Interval to 2.
14. In the Period field, specify the number of data points that the series takes to repeat a pattern. If the value is null or you do not specify any value, the Anomaly Detector API determines this value automatically.
15. In the Max Anomaly Ratio field, provide a value that specifies the maximum anomalies to be detected in terms of the ratio of total data points. You can specify a value between 0 and 0.5.
16. Click Done.
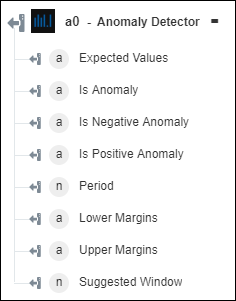
Output schema
For Detection Type as Entire Series, the output schema returns an array that provides anomaly details.
For Detection Type as Latest Point, the output schema returns a single Boolean or integer value that provides anomaly details.