Insights
ServiceMax Mobile Console allows you to view the ServiceMax Go app usage and adoption, specific to the Salesforce org where the Console is running. The console allows you to view the following.
• Activity
• Usage
• Sync
• Feedback
|
|
The Insights tab displays data for Go app. The data is updated every time when you refresh the page.
|
Activity
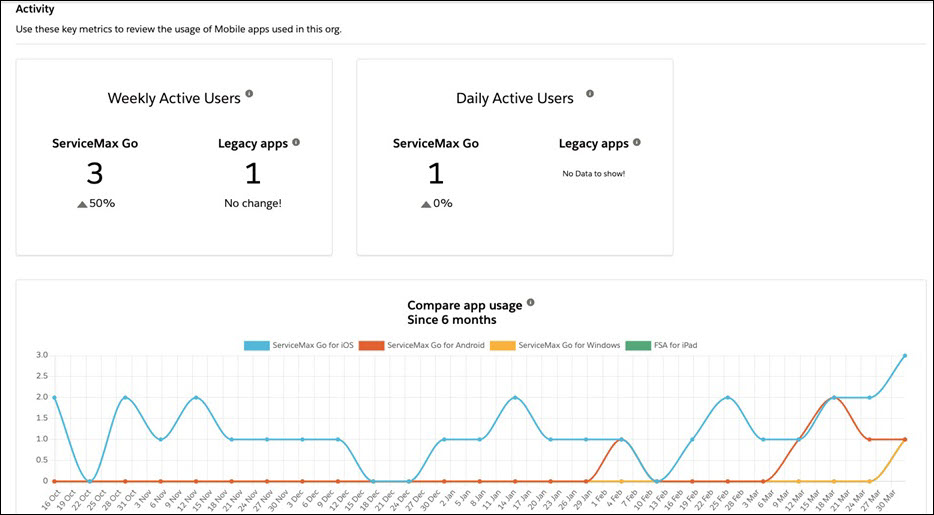
View the information about the number of app launches done in a week or a day by unique users that understand how much the adoption of the apps is improving. You can use the metrics and the chart to review the usage of the mobile apps specific to the Salesforce org where the Console is running.
With the Compare app usage chart, you can view the last six months' trend of the usage of all the apps that is specific to Salesforce org. You can view the following:
• Weekly Active Users metrics.
• Daily Active Users metrics.
• Compare app usage chart.
You can:
• Hover over the chart to view the details.
• Click Download Report to view the report in CSV format.
Usage
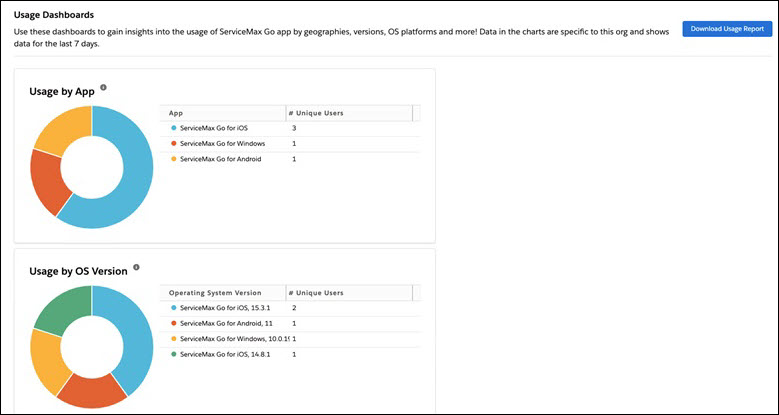
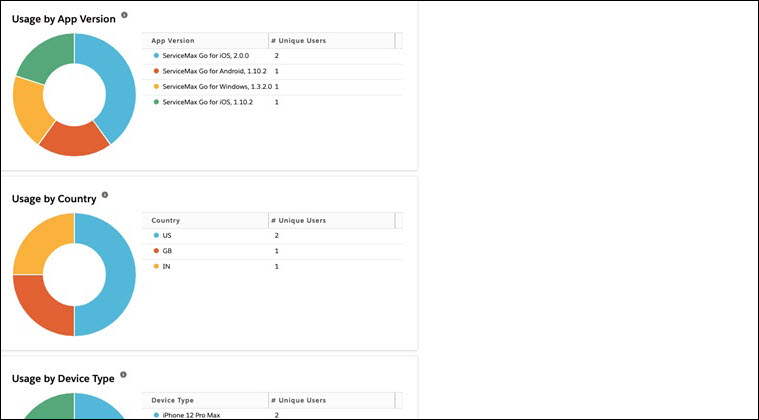
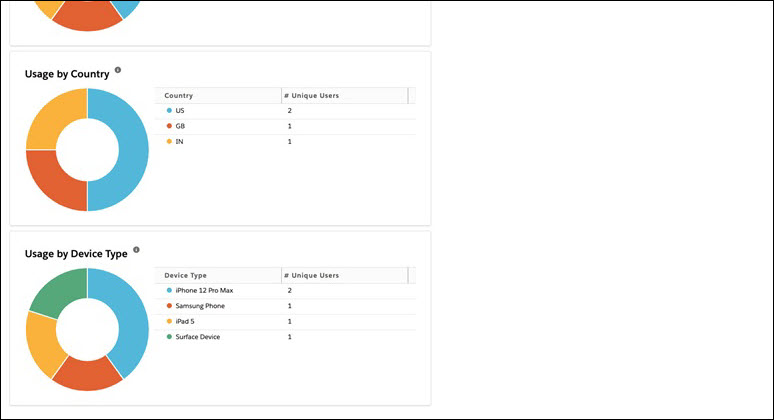
The charts display the data for the past seven days for the following categories. The data is specific to the Salesforce org where the Console is running.
• Usage by App
• Usage by OS Versions
• Usage by App Versions
• Usage by Country
The data regarding the usage by country is not affected by disabling the location tracking. The data uses the IP address of the user’s device. |
• Usage by Device type
You can:
• Hover over each chart to view the details.
• Click Download Report to view the report in CSV format.
Sync
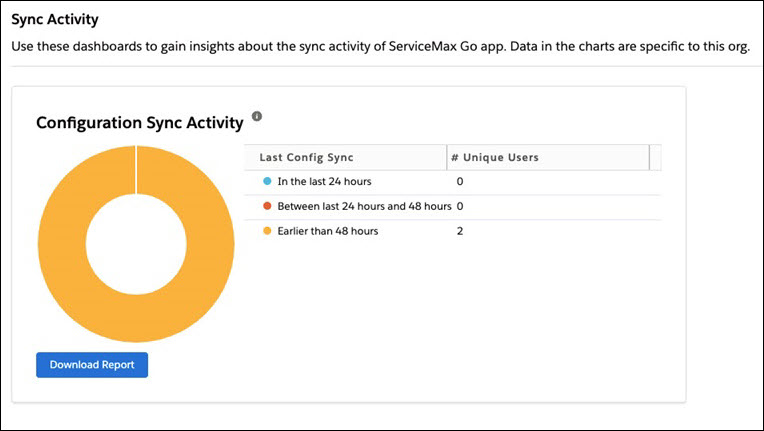
The dashboard displays the sync activity of the ServiceMax Go app. The data is specific to the Salesforce org where the Console is running. The sync activity is captured:
• In the last 24 hours
• Between the last 24 hours and 48 hours
• Earlier than 48 hours
Click Download Report to view the report in CSV format.
Feedback
The dashboard displays the details of the technician feedback that are submitted through the Submit Feedback button in the Go app. The feedback is captured by:
• the app platforms
• the feedback category
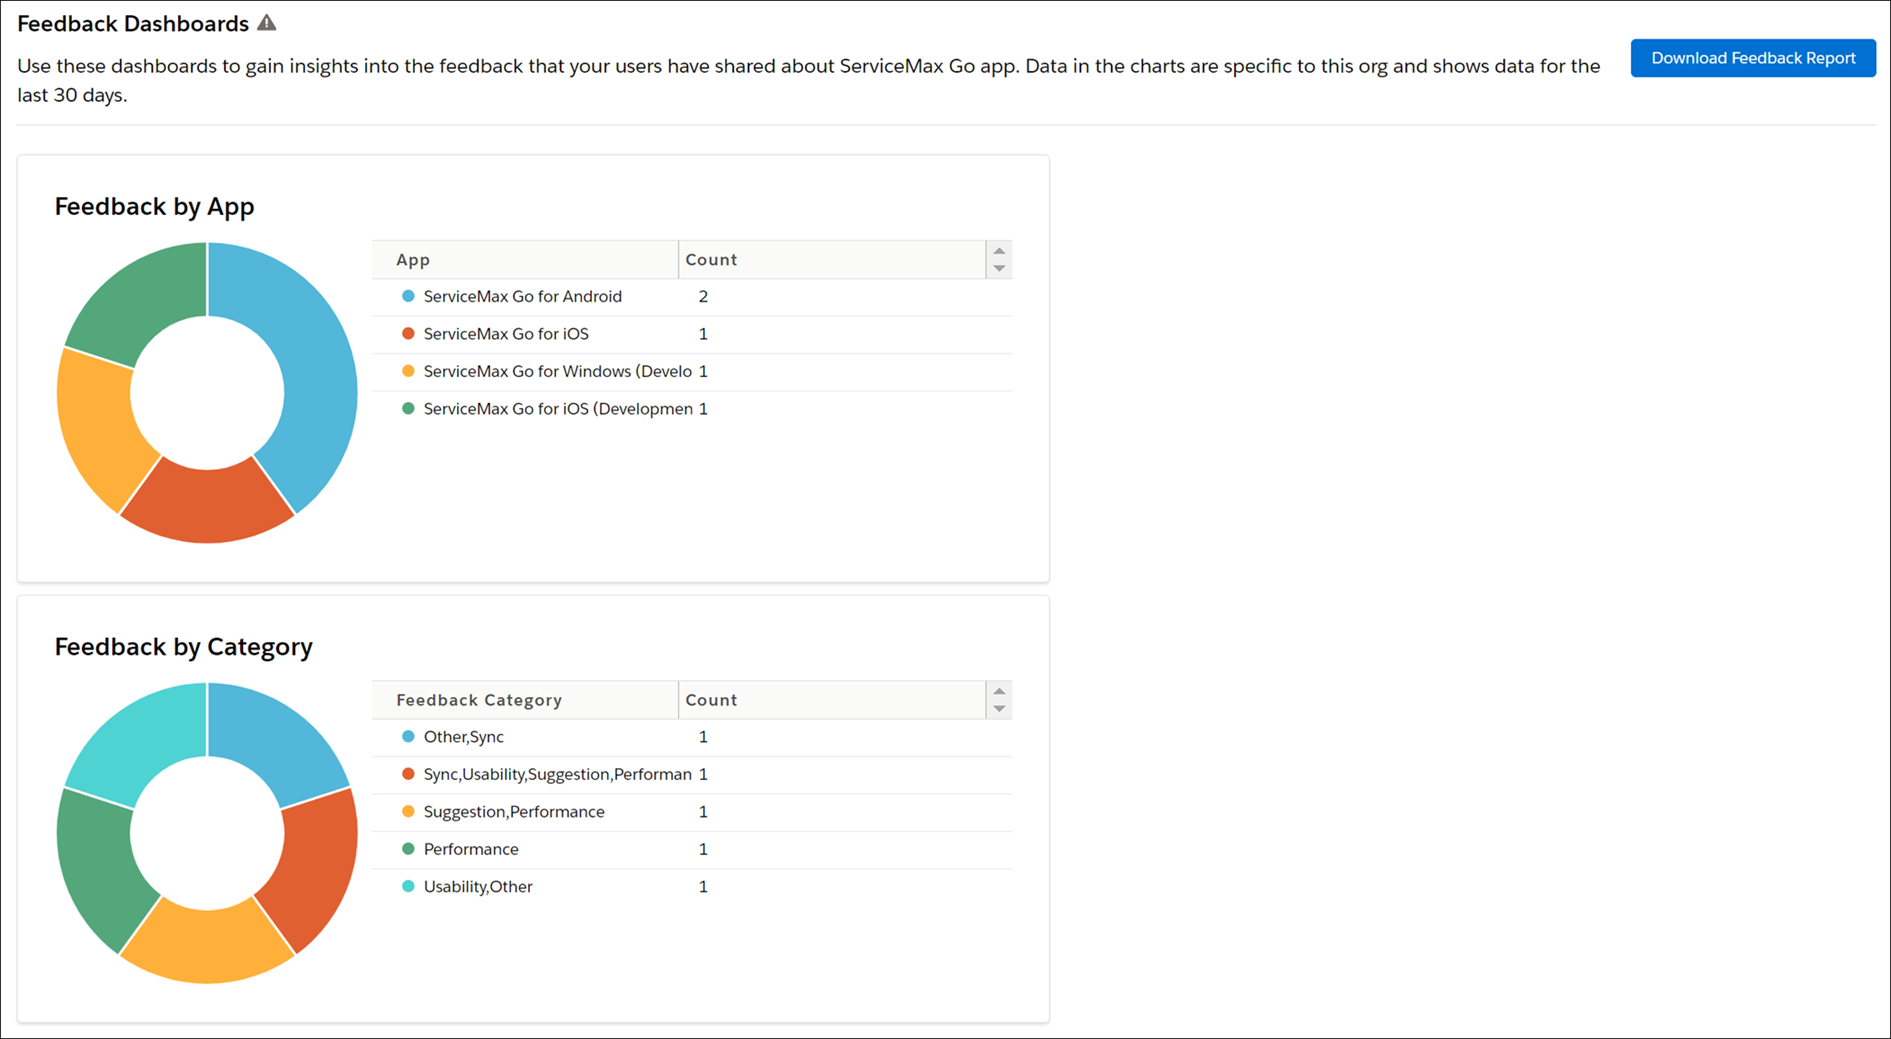
The data displayed in the charts are limited to the current org and for the past 30 days only. You can click Download Feedback Report to download the complete report in a CSV format.