Viewing Dashboards Related to Service Analytics
Asset 360 Analytics is a targeted app available for Service leaders to access all service analytics-related dashboards from one place. The dashboards will be available only when A360's Service Analytics package has been deployed in your organization.
Perform the following steps to add the Cost to Serve and Service Profitability dashboards.
1. Log in to Asset 360 Admin.
2. Navigate to the Asset 360 Analytics app.
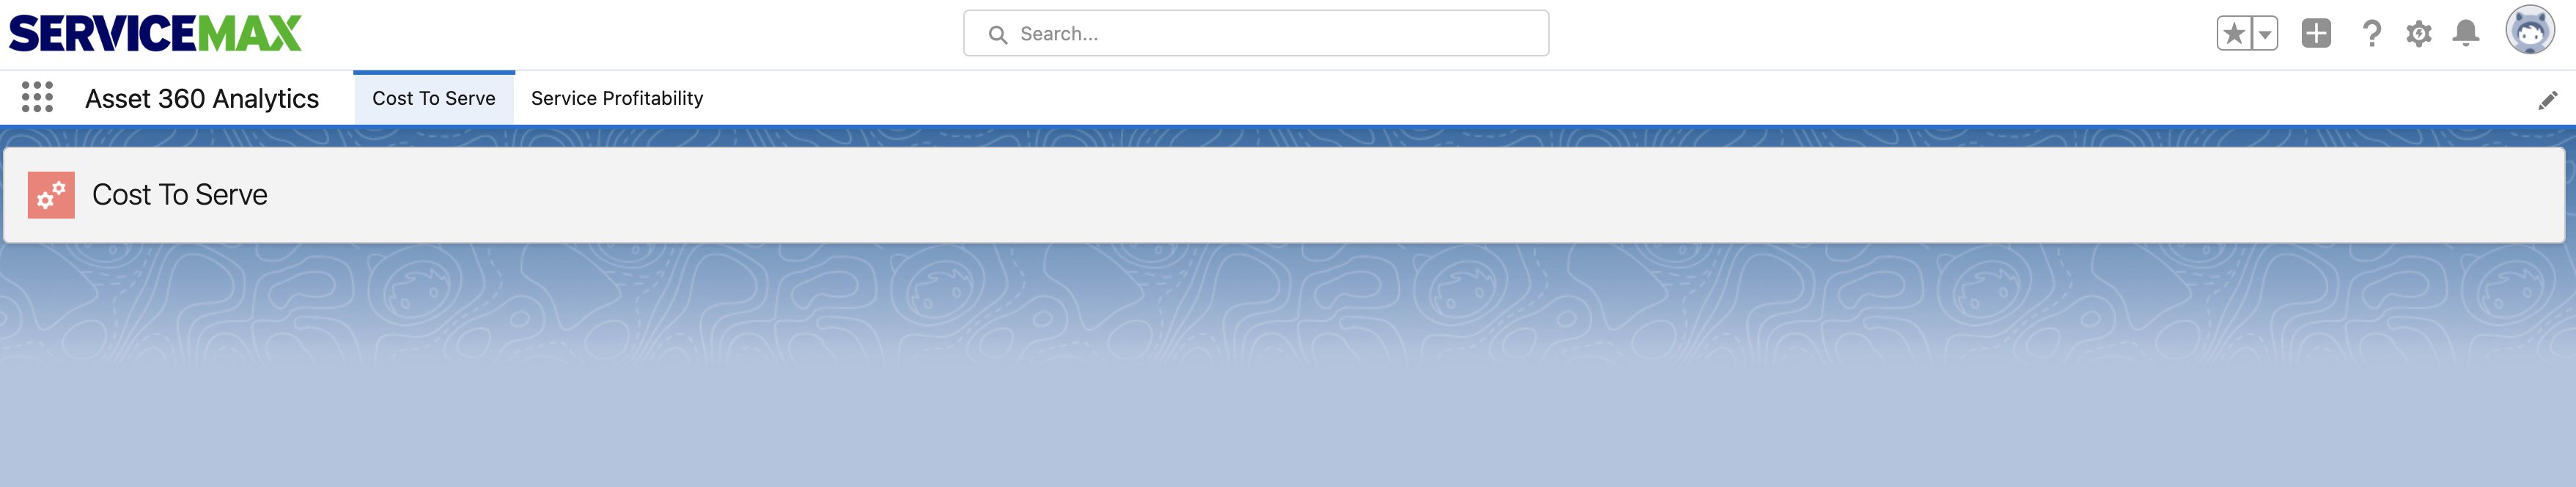
3. In the Cost to Serve tab, navigate to Setup > Edit Page.
4. From the Standard Components section on the left-side navigation, drag and drop the CRM Analytics Dashboard component.
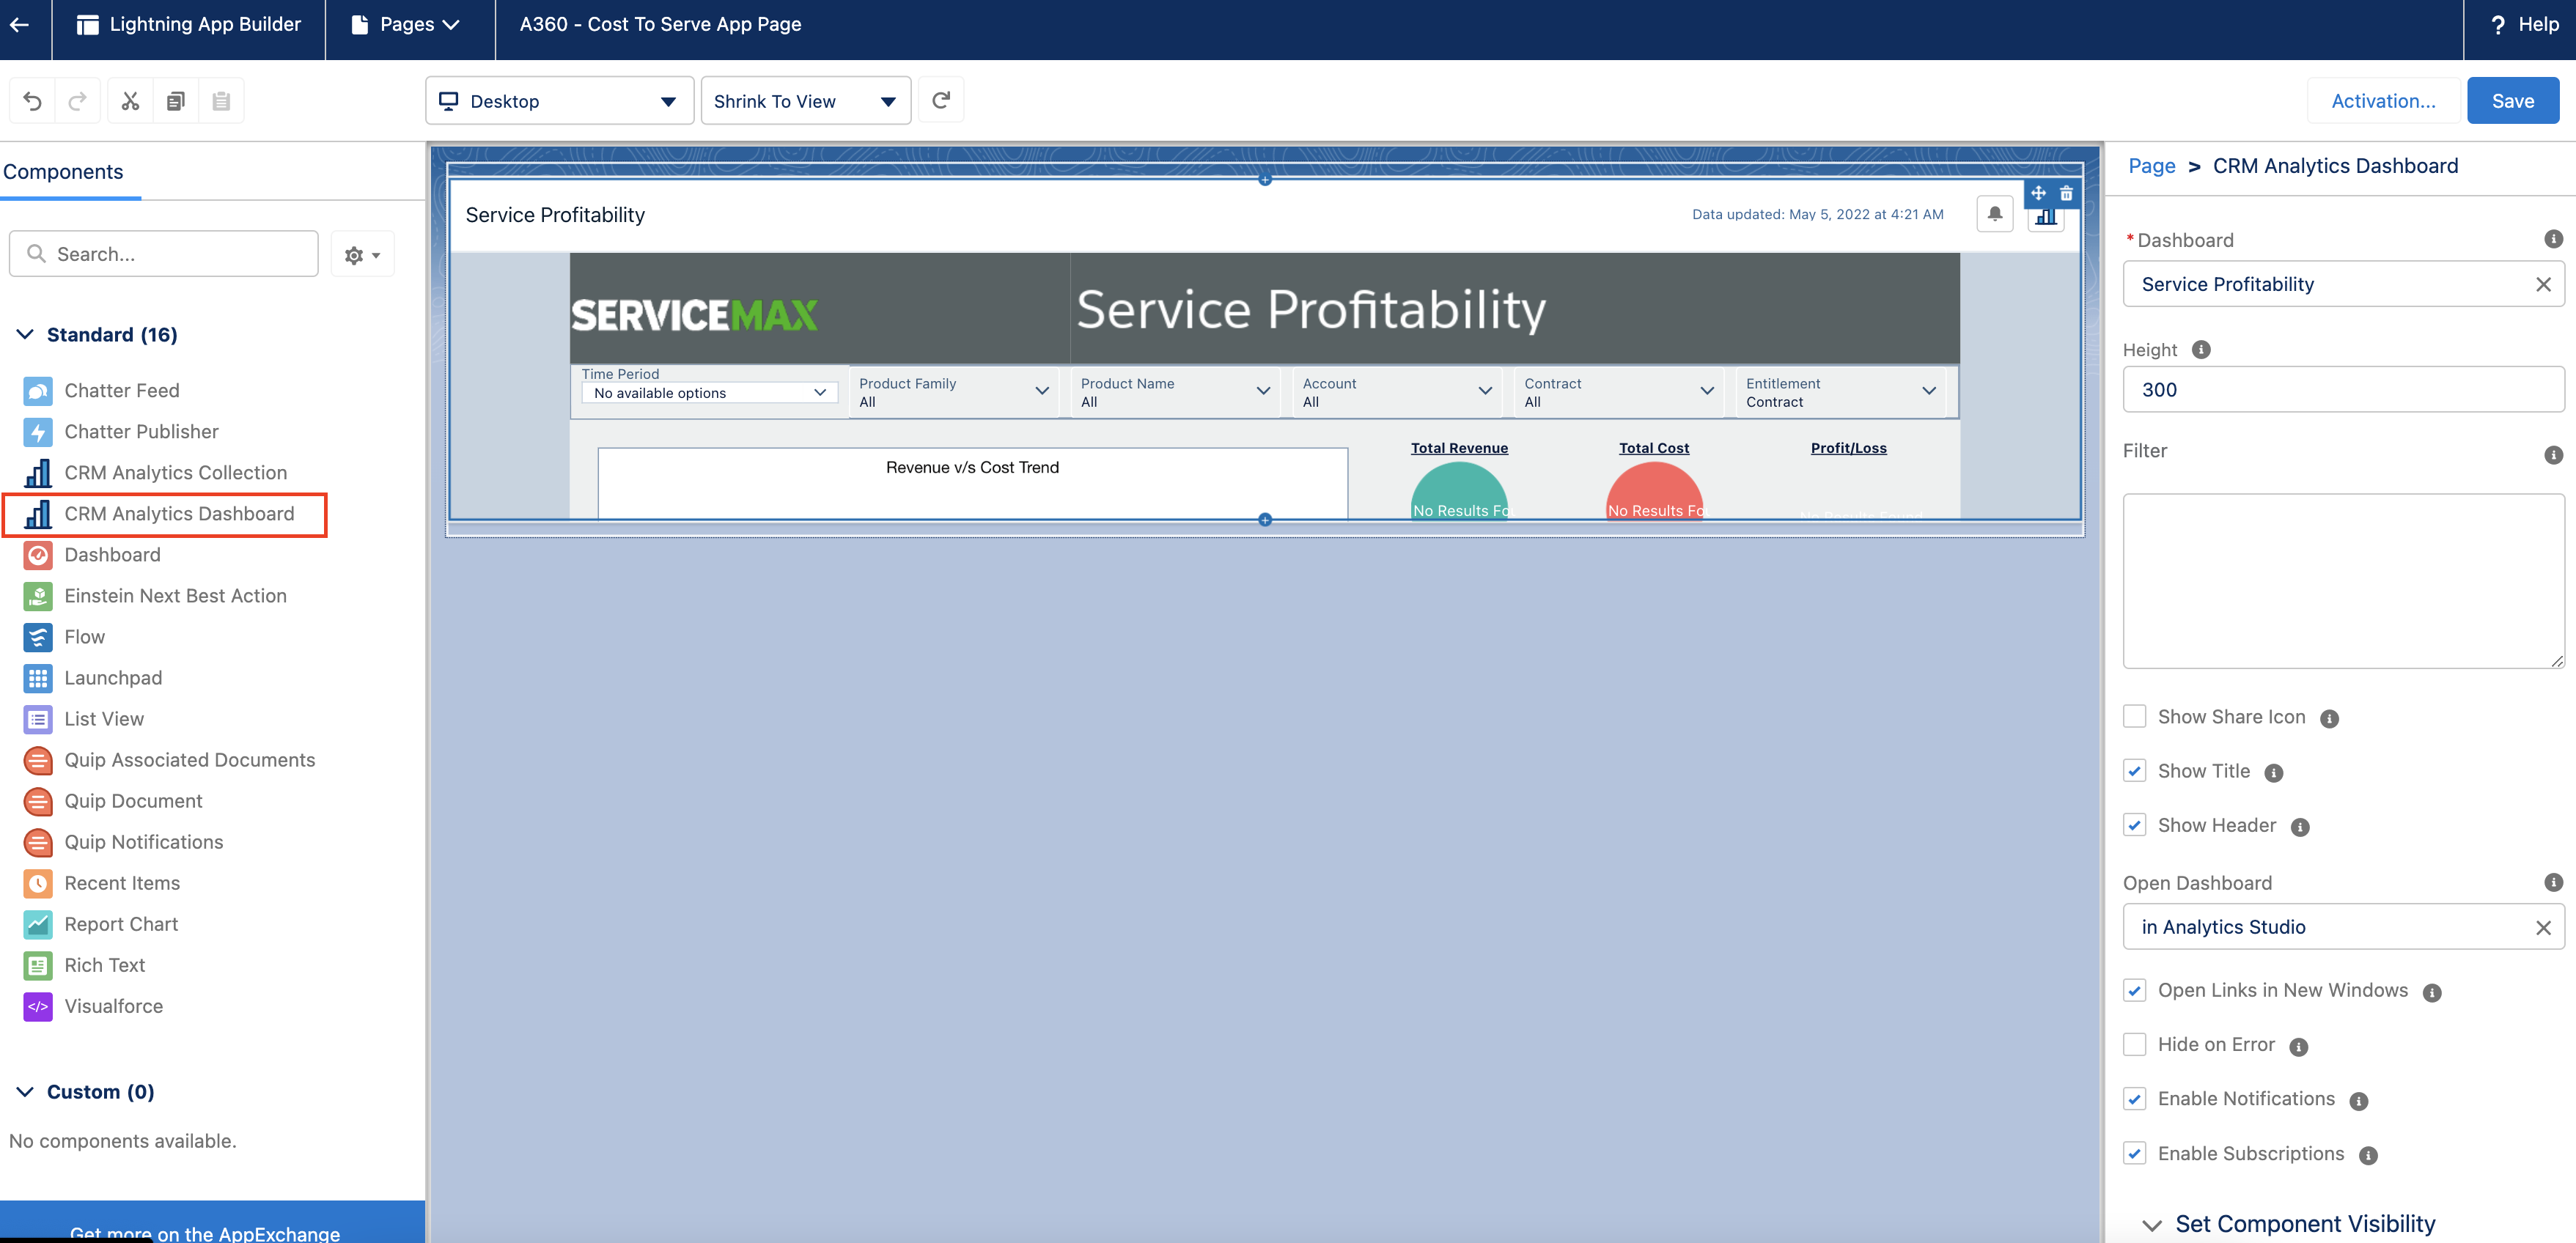
5. Edit the following attributes for the dashboard settings:
◦ Dashboard: Cost to Serve
◦ Height: 1200 px
6. Click Save.
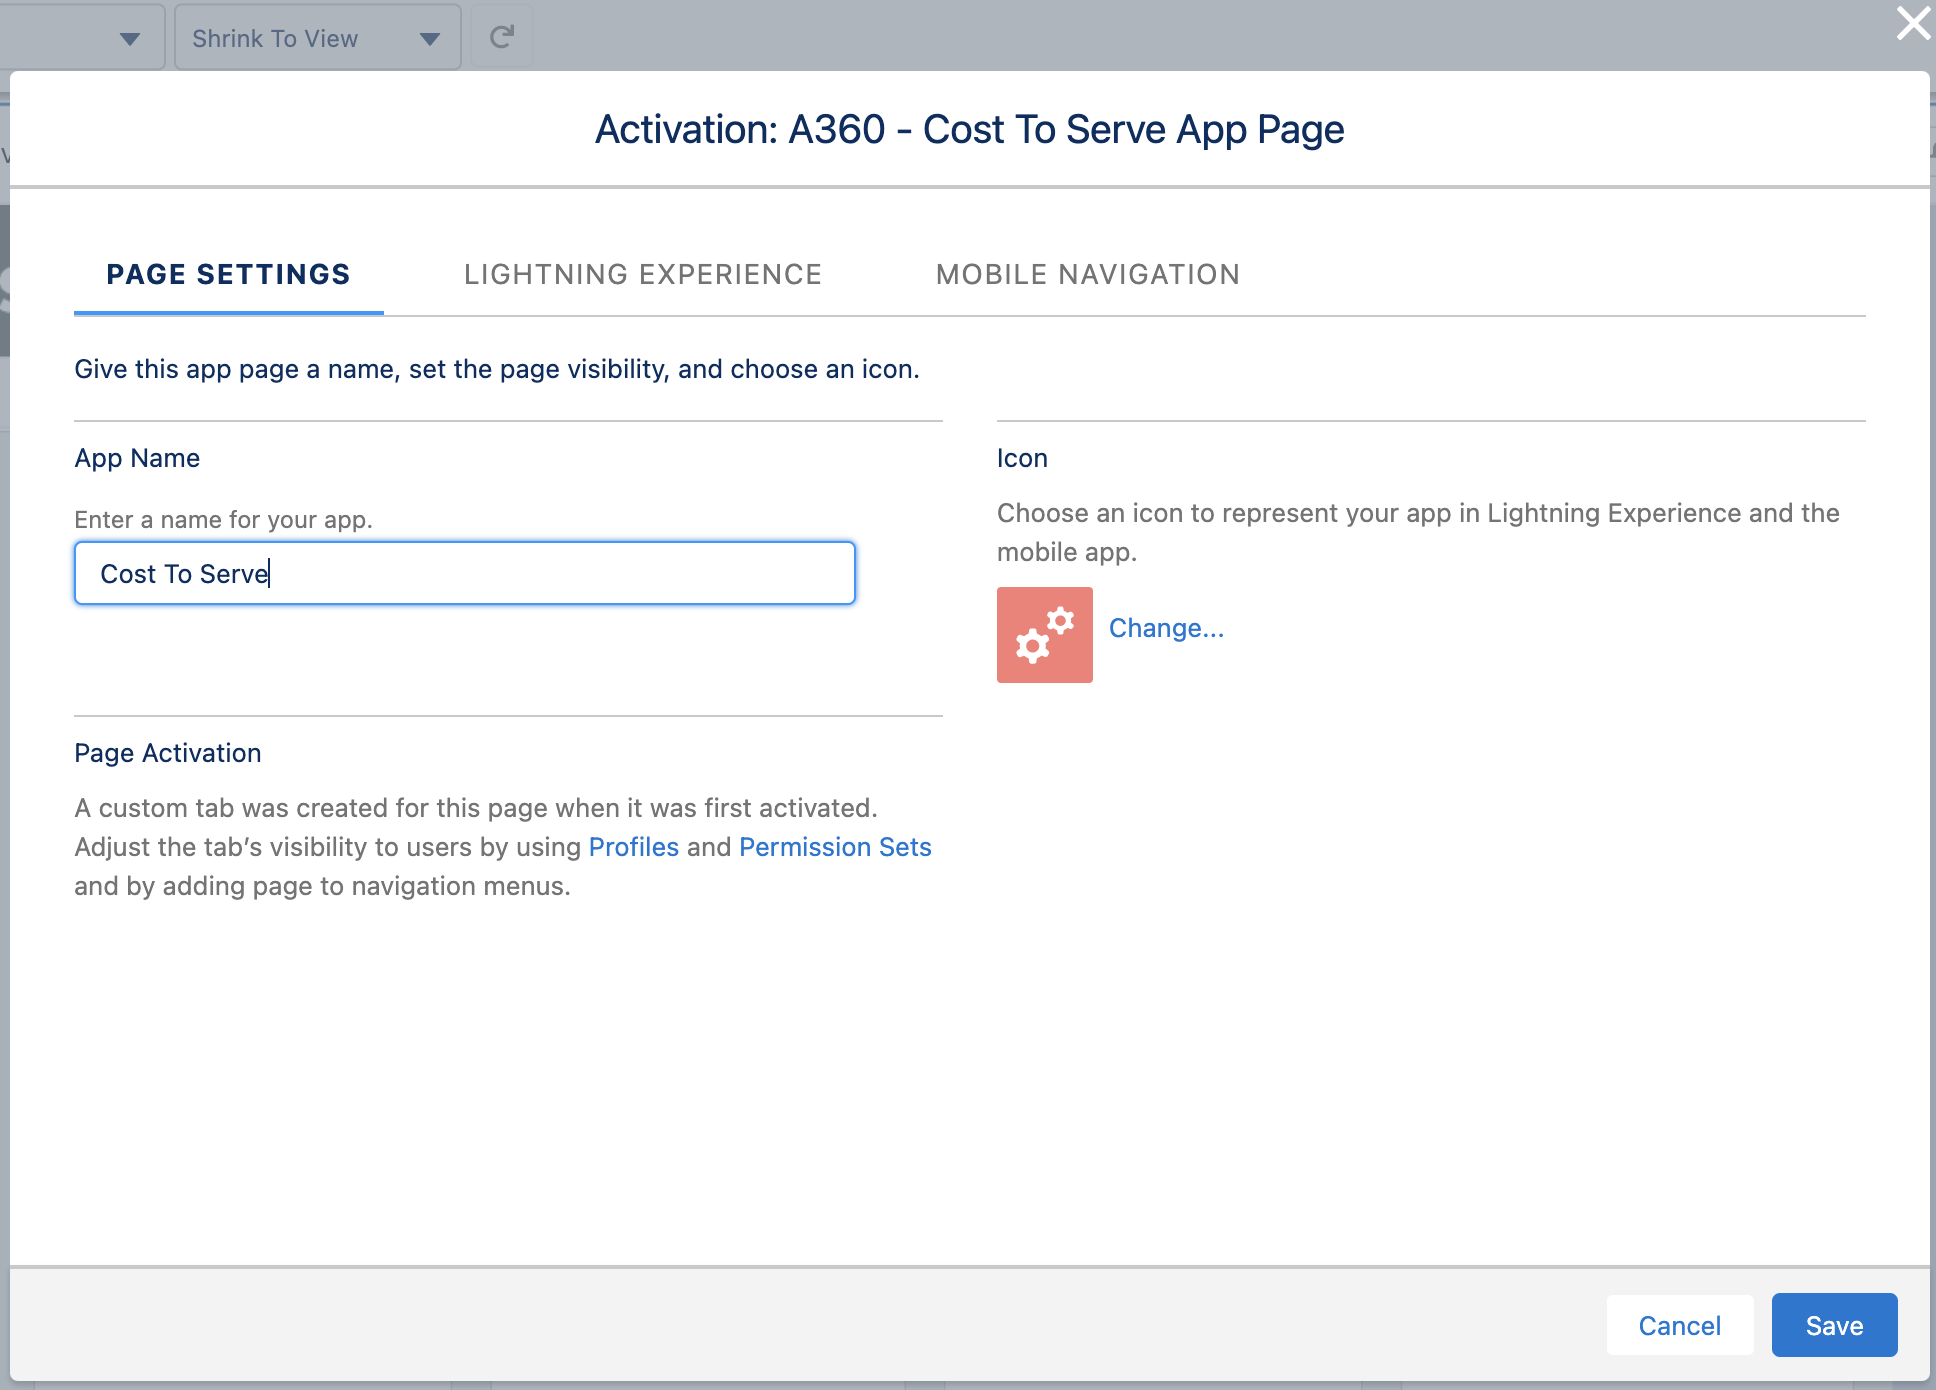
7. Click Activation and then click Save.
8. Navigate back to the dashboard page. The Cost to Serve dashboard is displayed.
9. Follow the same process for the Service Profitability tab and select Service Profitability in the Dashboard field.
10. Follow the same process for the Asset Insights tab and select A360 - Asset Insights Dashboard in the Dashboard field.
|
|
You can also view the Service Profitability, Cost to Serve, and Asset Insights dashboards in Analytics Studio.
|
Temporary Workaround to Add Dashboard Components
As the Cost to Serve and Service Profitability lightning pages are managed, the dashboard components may not be added as per the guidelines. Perform the following temporary workarounds to add the dashboard components to the lightning pages.
1. Launch the Asset 360 Analytics app and open the Cost to Serve and Service Profitability lightning app pages.
2. Navigate to Setup > Edit Page.
3. Clone the lightning pages.
4. Add the Cost to Serve and Service Profitability dashboards to the cloned lightning app pages.
5. Click Save.