Service Analytics Dashboards
Service Analytics dashboard helps service leaders know how much it costs the organizations to maintain product quality, view profitability trends, identify business-impacting factors, and identify gaps in their service processes to take necessary corrective steps.
The Service Analytics template provides the following dashboards:
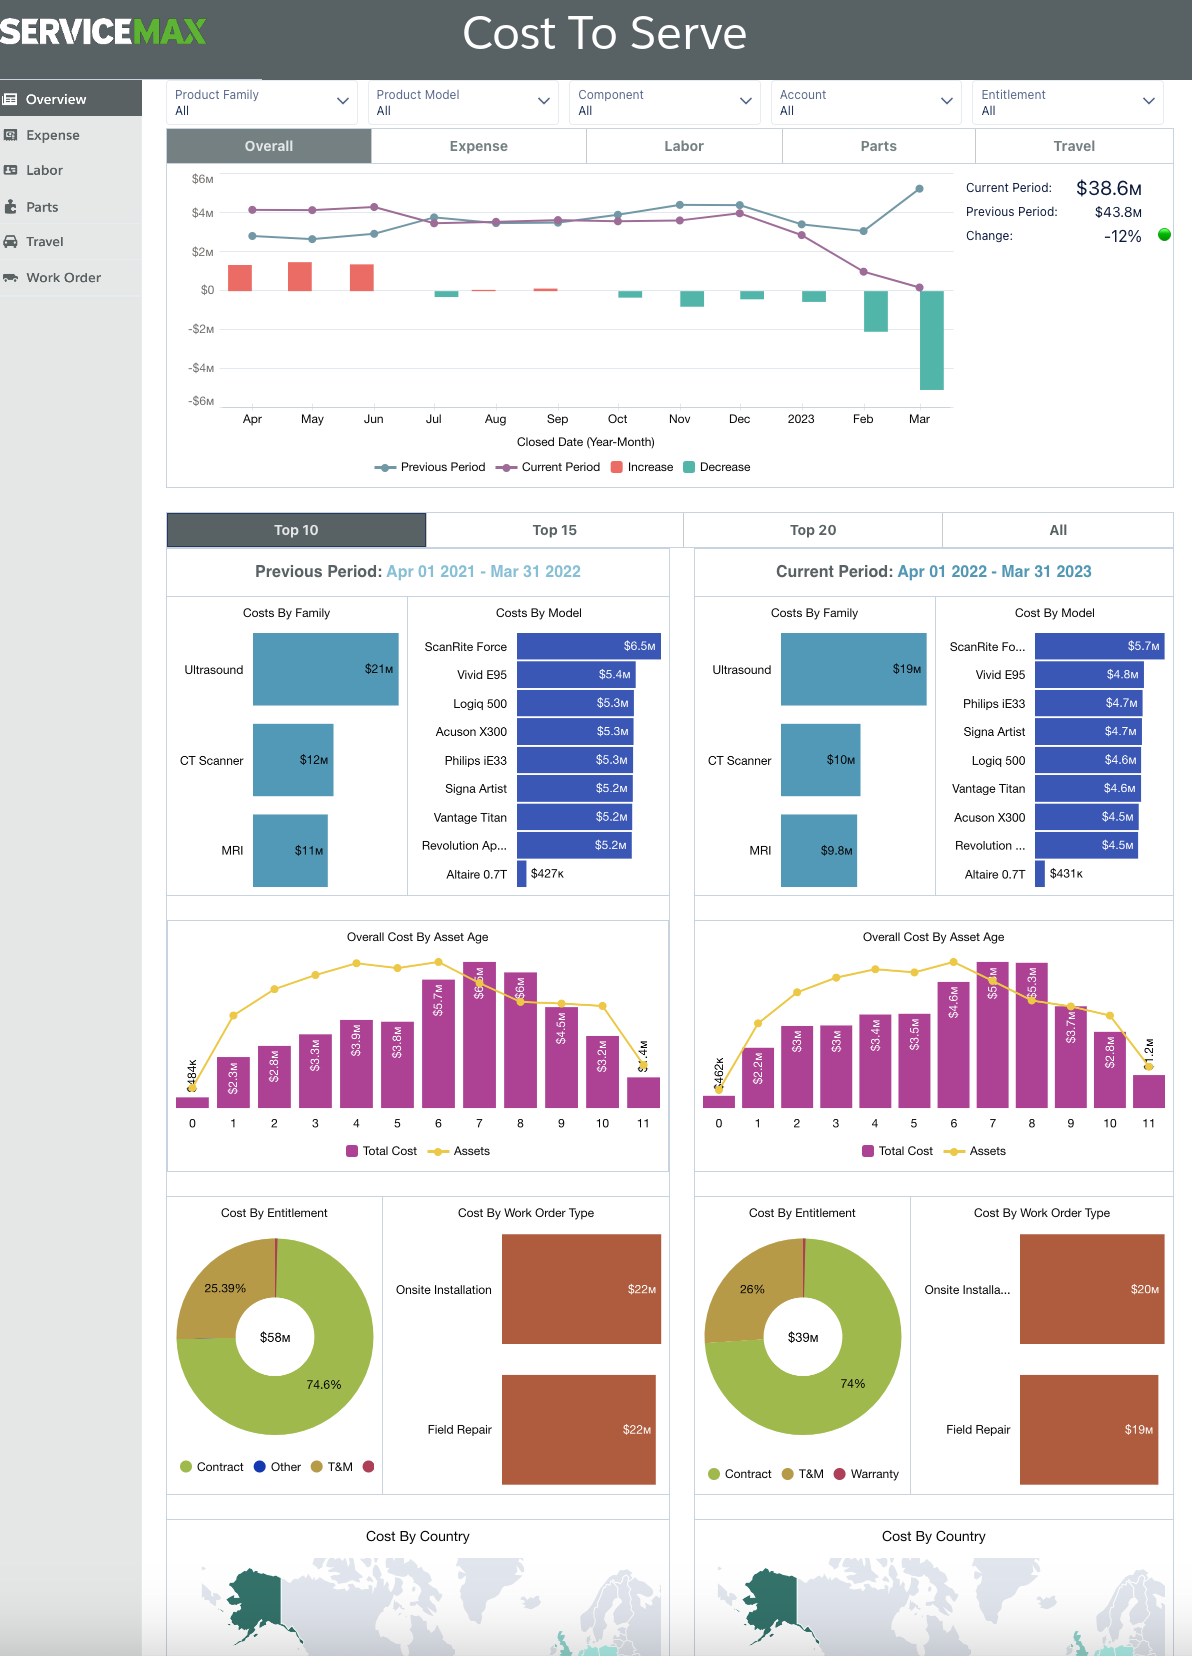
• Cost To Serve: This dashboard provides more visibility into the cost of a service organization to maintain the quality of assets compared to the previous year. It also allows you in-depth visibility into the category, group, and activities where service cost is more and the reason behind it.

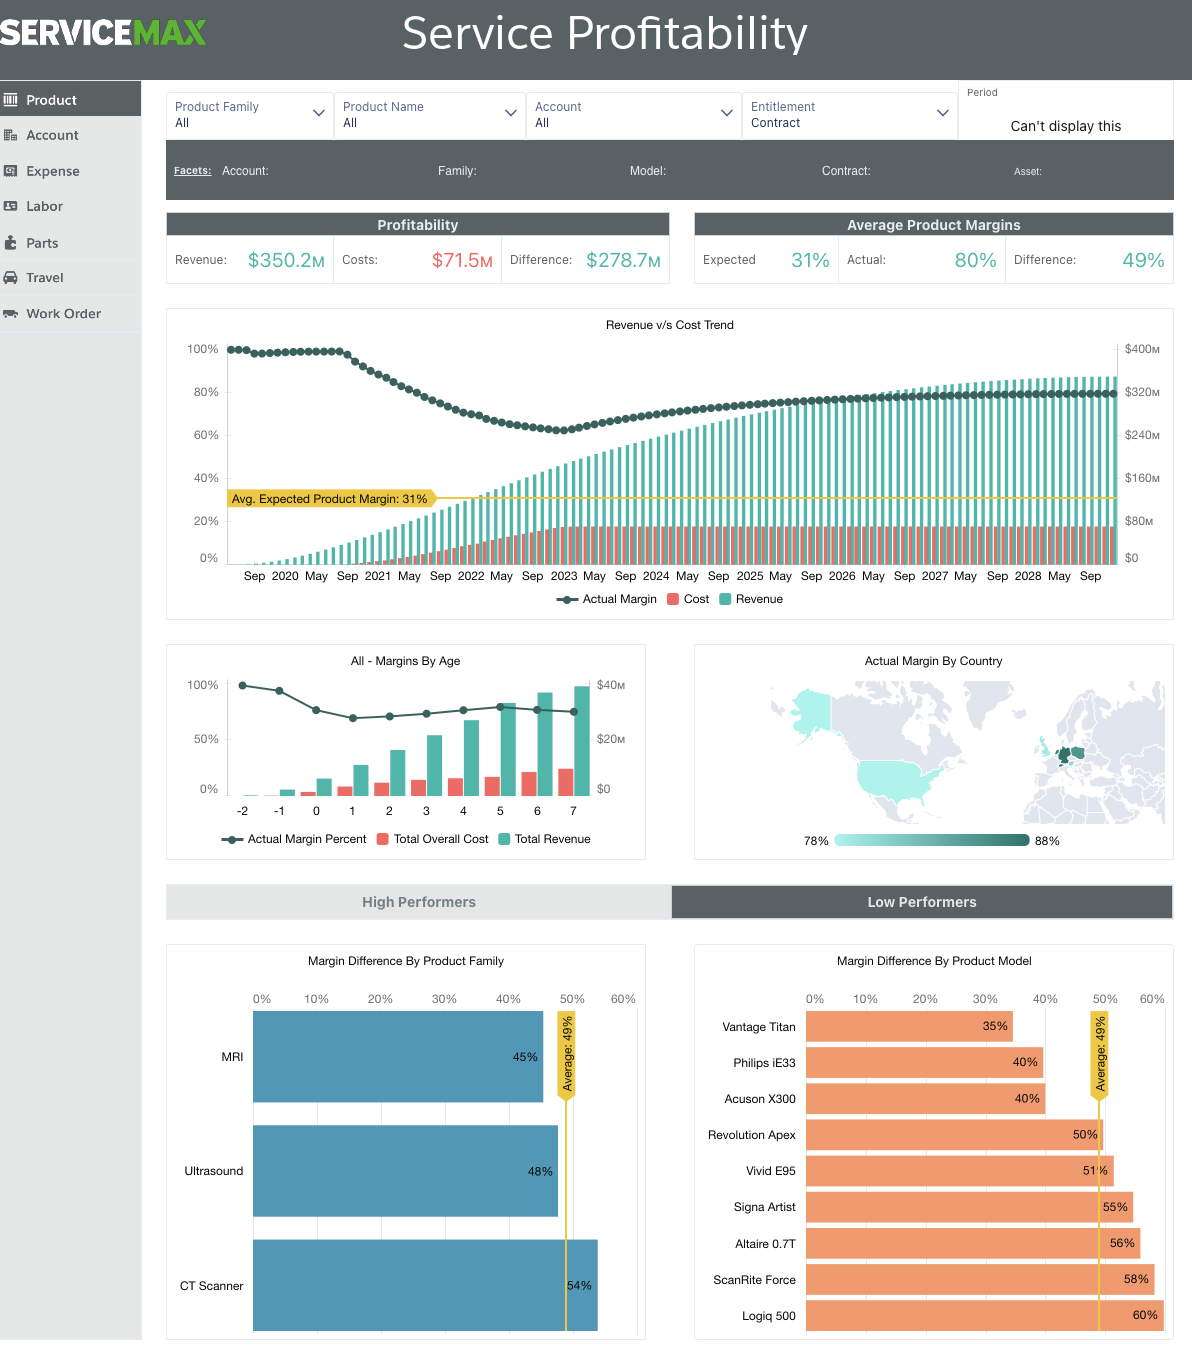
• Service Profitability: This dashboard provides real-time profitability indicators to react, adjust service offerings, and maximize margin revenue. The service profitability dashboard provides overall profitability details but also displays month-over-month revenue vs. cost trends for 12 months.

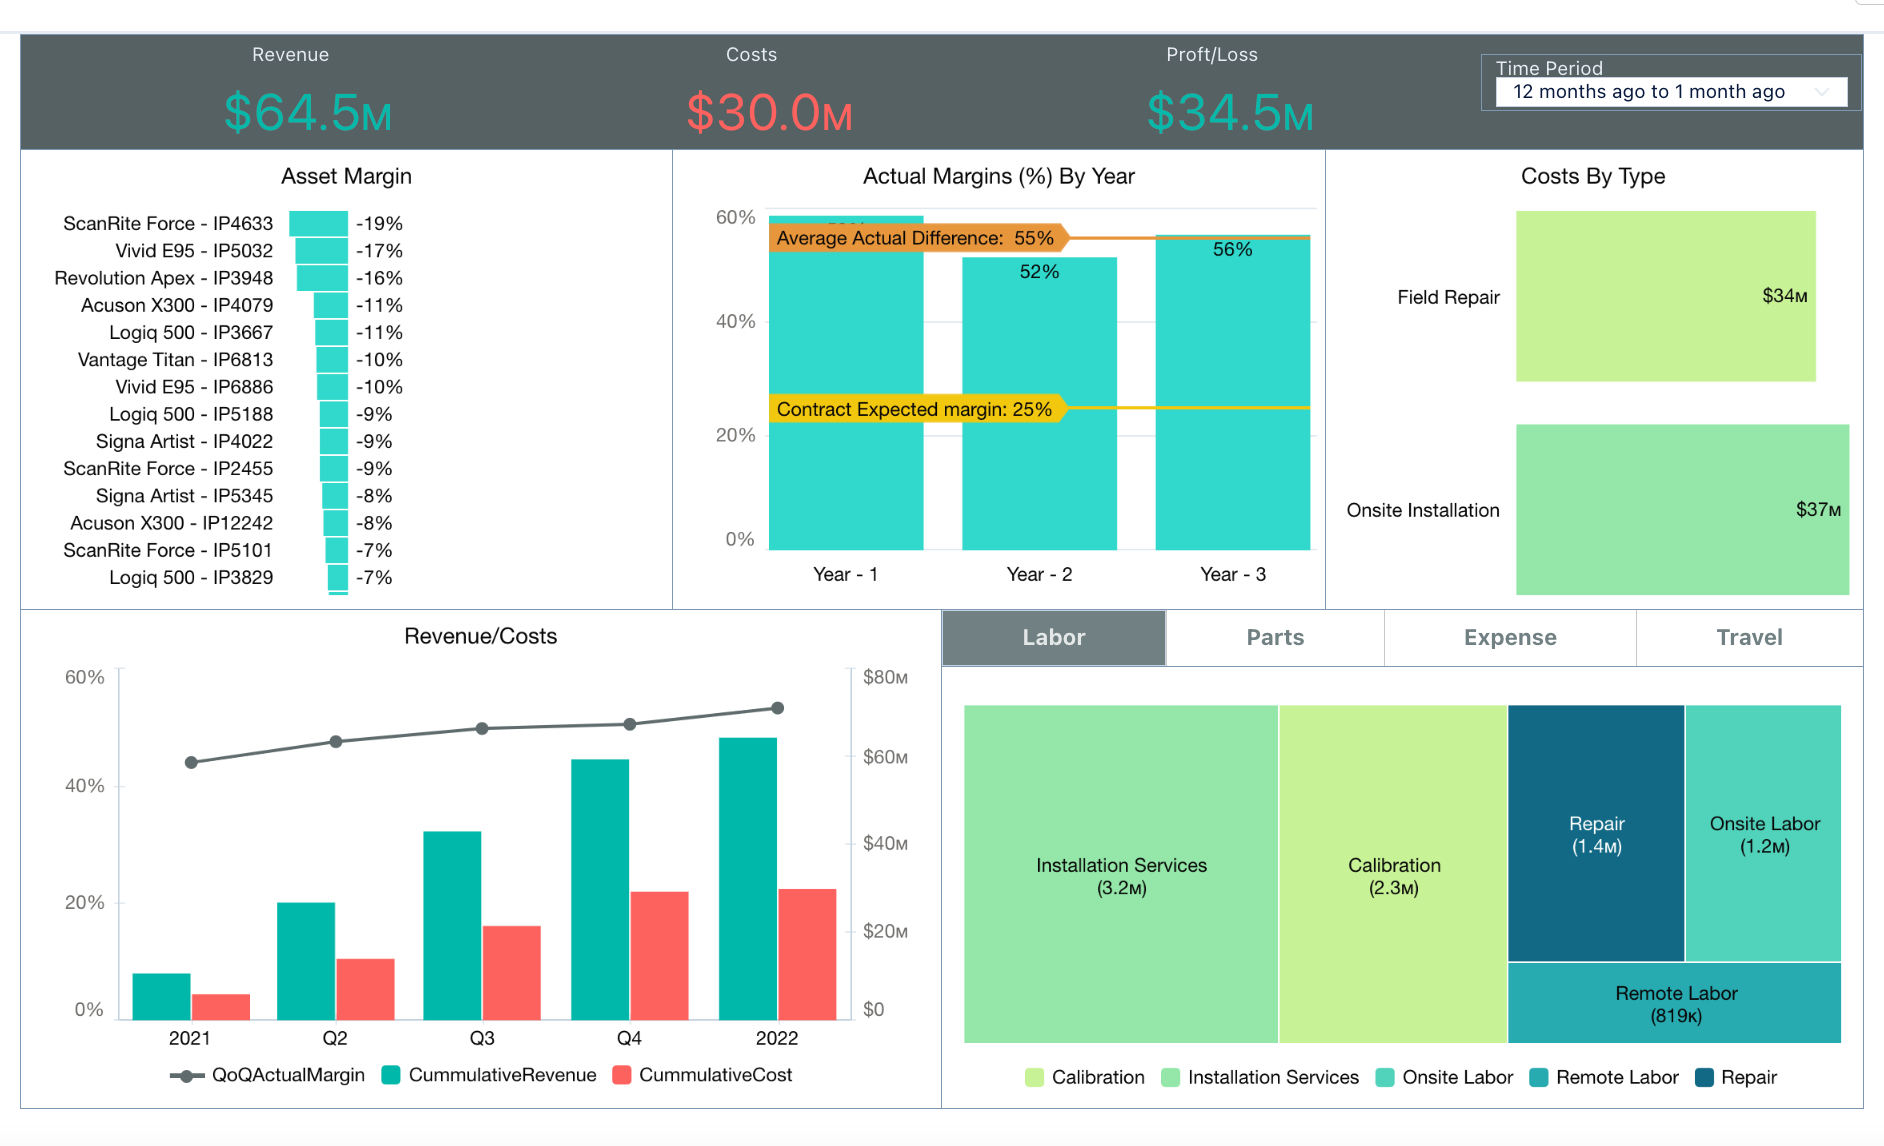
• Contract Insights: This dashboard provides insights into the profitability of a service contract at a glance to take corrective steps.

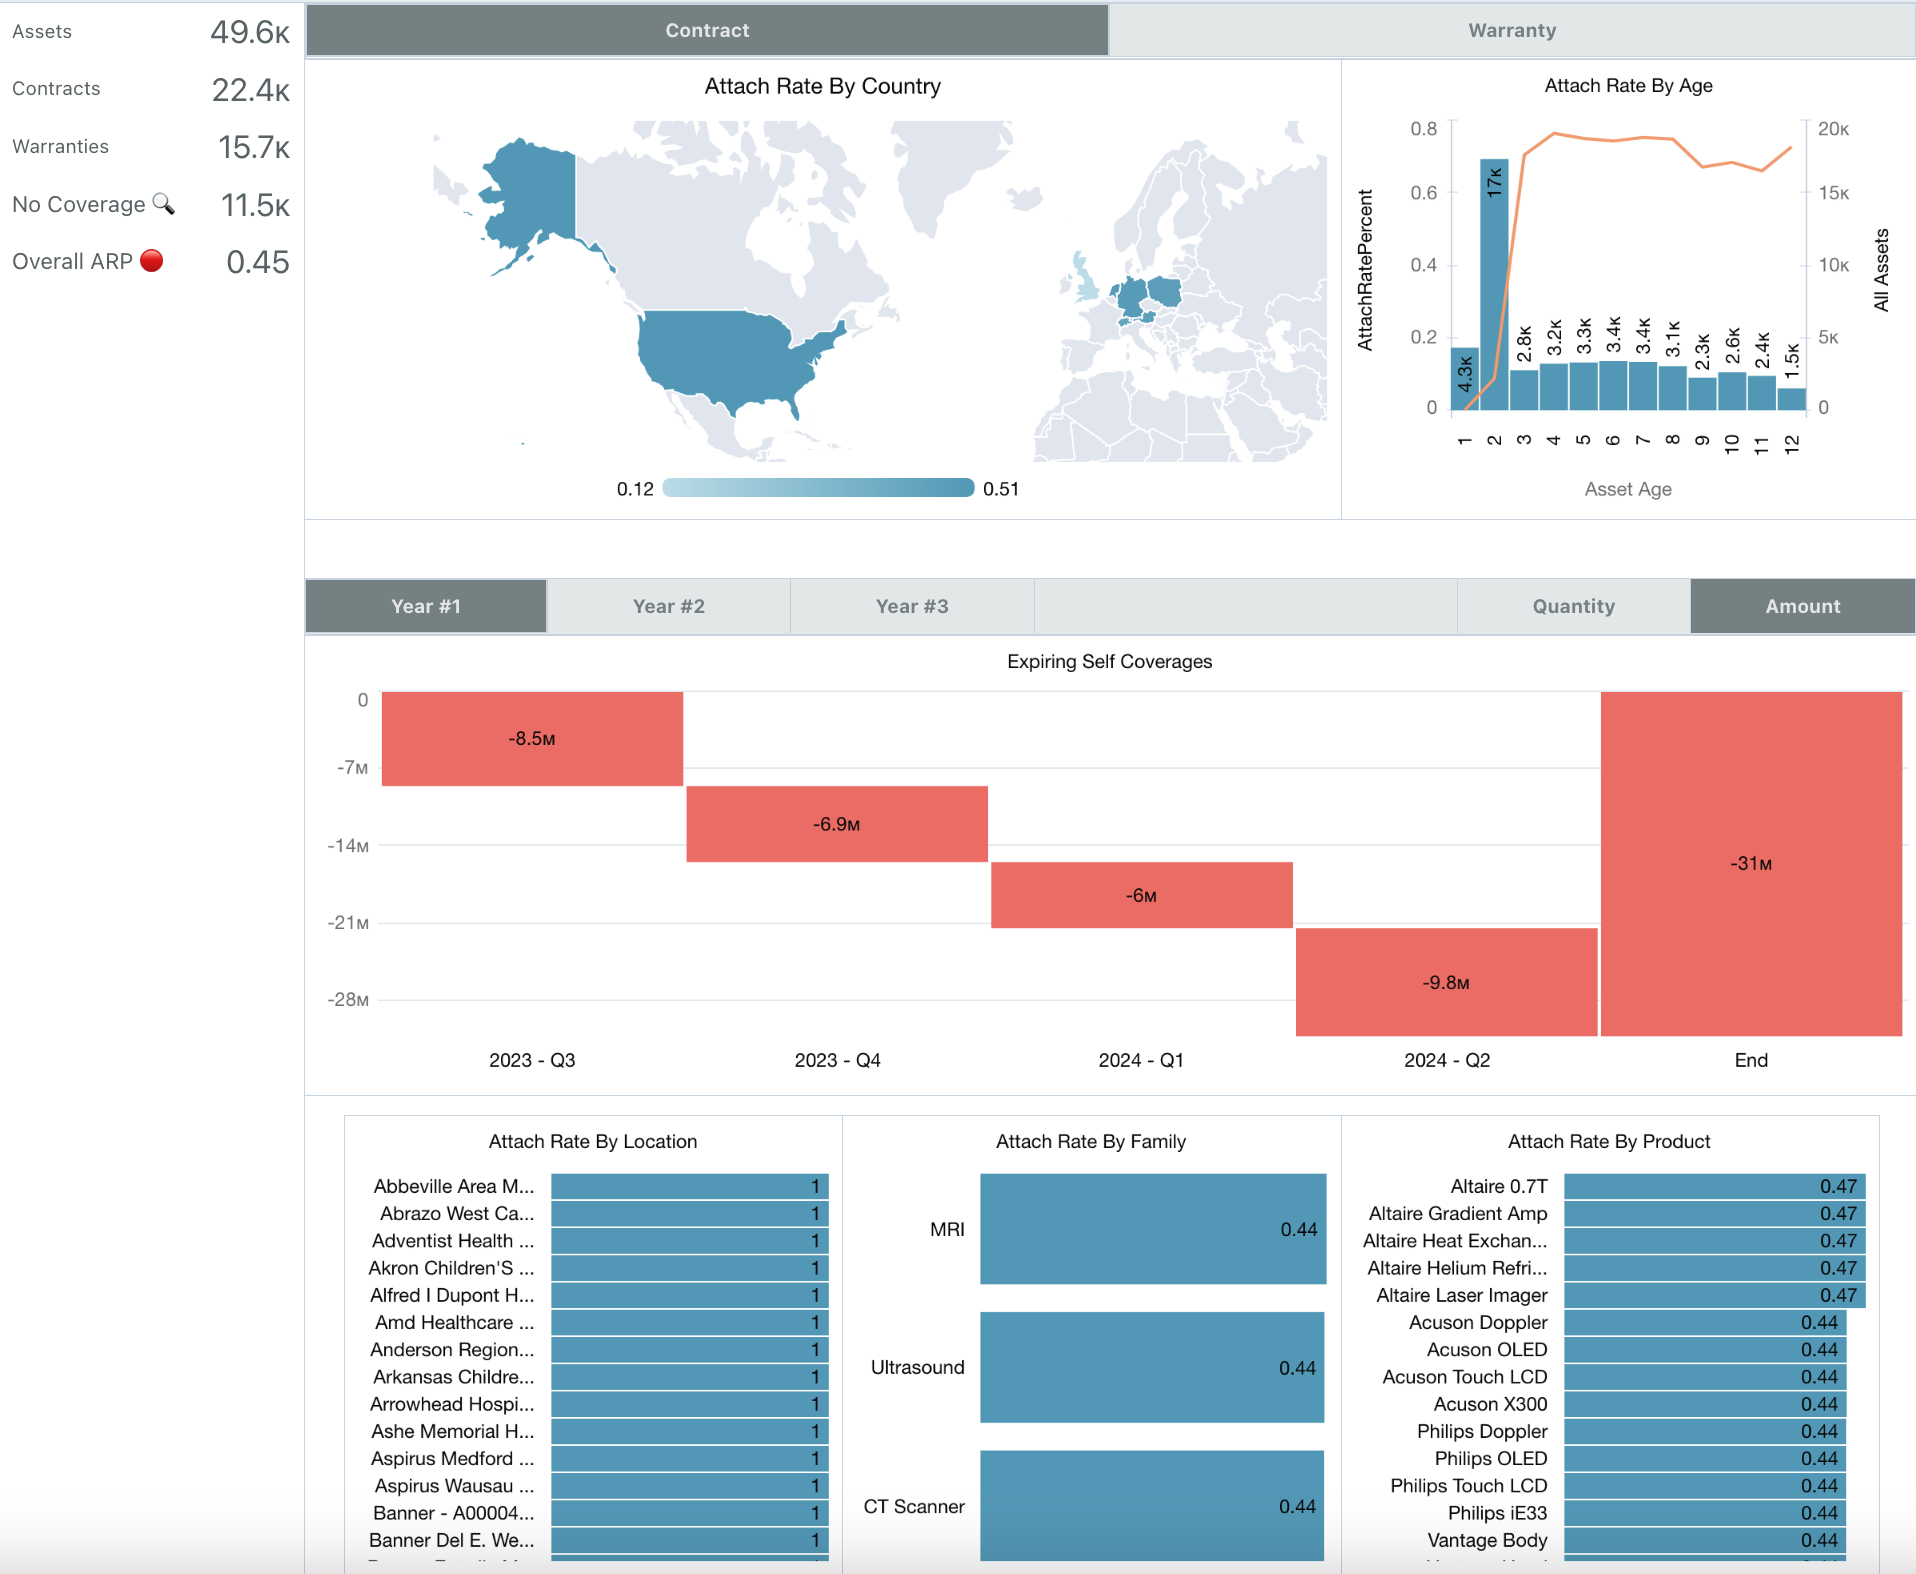
• Account Attach Rate: This dashboard provides account insights to know how profitable is the account based on the revenue generation and sales opportunity.
