Analysis Mashup
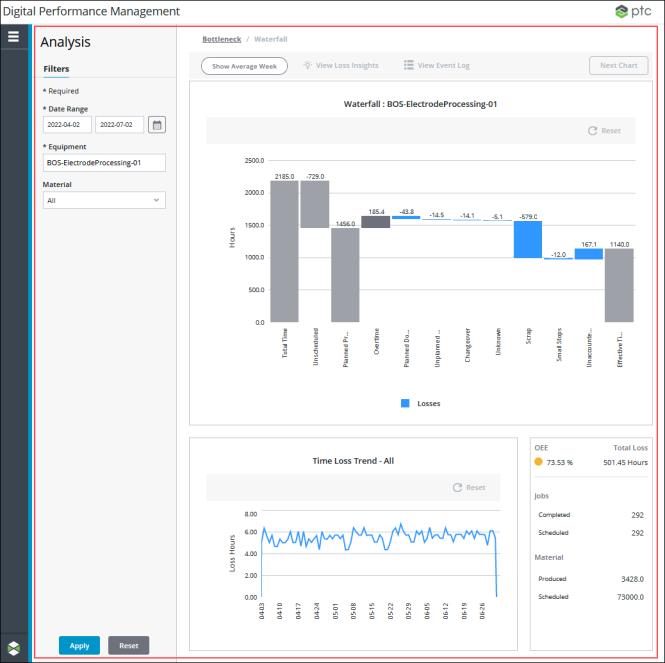
The analysis mashup (PTC.PerformanceAnalysis.Analysis_MU) is the main mashup for the Performance Analysis tool. It includes the Filters pane, a contained mashup for the navigation header, a contained mashup which displays the waterfall, Pareto, or trend charts, a contained mashup for showing the trend chart in the bottom pane, and a contained mashup for displaying the capacity pane or time loss details pane, as appropriate.

Widgets
The PTC.PerformanceAnalysis.Analysis_MU mashup uses the following widgets:
• Multiple Label widgets.
• A Date Time Picker widget for the Date Range filter.
• Multiple Button widgets:
◦ For the Equipment filter, used to launch the Select Equipment window.
◦ For the Apply and Reset buttons.
• A DropDown widget for the Material field.
• Multiple Contained Mashup widgets:
◦ For the navigation header mashup.
◦ For displaying the waterfall mashup, Pareto mashup, trend mashup, capacity panel mashup, and time loss details mashup, as appropriate.
Inputs
The input parameters for the PTC.PerformanceAnalysis.Analysis_MU mashup are:
• materialMasterUid—The UID for the material selected in the applied Material filter.
• startDate——The start date from the applied Date Range filter.
• endDate——The end date from the applied Date Range filter.
• isShowAverageWeek—A Boolean indicating the state of the Show Average Week button.
• equipmentUID—The UID for the equipment in the applied Equipment filter.
• equipmentThingName—The name of the Thing for the equipment selected in the applied Equipment filter.
• equipmentName—The display name of the equipment selected in the applied Equipment filter.
• containedMashupChanged—Boolean that prompts the refresh of the contained mashup showing the waterfall, Pareto, or trend chart as the navigation is traversed.
• managerName—The name of the manager Thing from which the services on this mashup are run.
Outputs
The output parameters for the PTC.PerformanceAnalysis.Trend_MU mashup are:
• containedMashupChanged—Boolean that prompts the refresh of the contained mashup showing the waterfall, Pareto, or trend chart as the navigation is traversed.
• materialMasterUid—The UID for the material selected in the applied Material filter.
• startDate——The start date from the applied Date Range filter.
• endDate——The end date from the applied Date Range filter.
• equipmentUID—The UID for the equipment in the applied Equipment filter.
• equipmentThingName—The name of the Thing for the equipment selected in the applied Equipment filter.
• equipmentName—The display name of the equipment selected in the applied Equipment filter.
Services
The mashup uses the following dynamic services from the PTC.PerformanceAnalysis.Management_TS Thing Shape:
• GetChartTitle—Retrieves the equipment and material information used in the chart title.
• GetMaterialMasters—When a work center is selected in the Equipment filter, this service retrieves the material masters for the work center, the area to which the work center belongs, and the pacemaker of the work center.
• GetMfgModelManager—Retrieves the name of the registered PTC.MfgModel.Manager. This service looks first at the ManagerConfiguration table on the PTC.PerformanceAnalysis.Manager Thing to see if it finds an entry for the specific id value. If it does not find an entry there, the service then looks at the DefaultGlobalManagerConfiguration table on the PTC.Base.Manager Thing.
• GetPanelMashup—Retrieves the name of the mashup to show in the bottom right pane. When nothing in the chart is selected, the service retrieves the capacity panel mashup name. When a bar is selected in the chart, the services retrieves the time loss panel mashup name.
• GetTrendMashupsConfiguration—Retrieves the mashup to show in the bottom left pane. When no filter is applied, this is the empty details mashup, When a filter is applied, this is the trend chart mashup.
• IsEnterpriseOrRegion—Determines whether the equipment that is selected in the applied Equipment filter is an enterprise or region. When an enterprise or region is selected, the View Event Log button is disabled.
• IsWorkCenter—Determines whether the equipment that is selected in the applied Equipment is a work center. When a non-work center is selected, the Material filter and the Next Chart button are disabled.
Dynamic services allow you to select the entity to execute a service at runtime. In this case, the service can be executed from any entity that implements the PTC.PerformanceAnalysis.Management_TS Thing Shape. For more information, see Dynamic Services in the Mashup Builder section of the ThingWorx Help Center.