Performance Analysis Modular Mashups
Performance Analysis includes the following modular mashups. These modular mashups can be replaced by editing the MashupConfiguration table on the PTC.PerformanceAnalysis.Manager. For more information, see Replacing Modular Mashups.
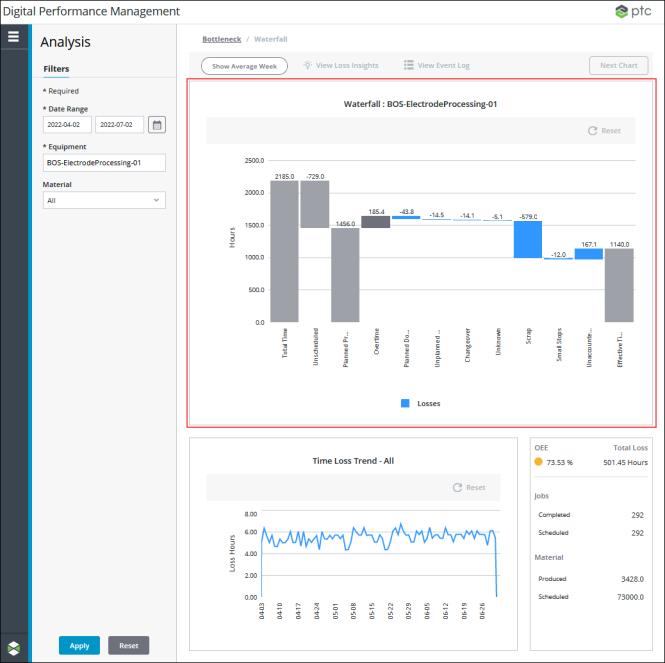
Capacity Mashup
• Original mashup name: PTC.PerformanceAnalysis.CapacityPanel_MU
• id value in the MashupConfguration table: PTC.PerformanceAnalysis.Capacity
• For more information, see Capacity Panel Mashup.
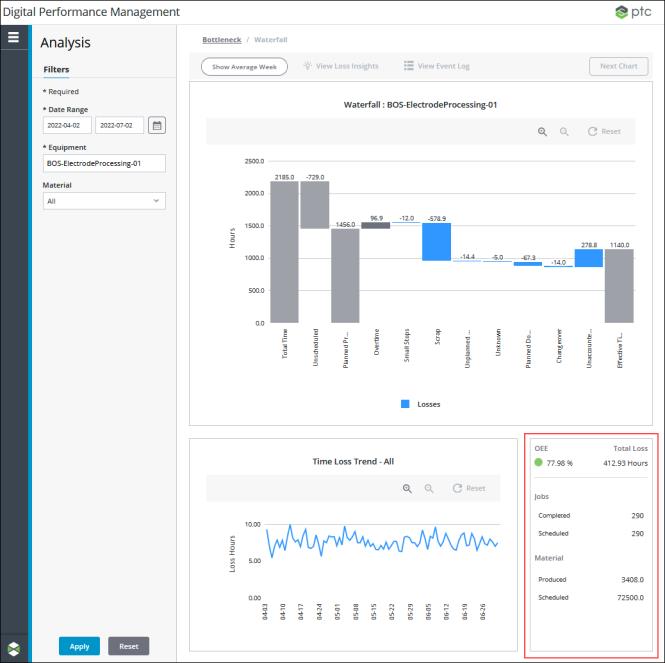
Empty Details Mashup
• Original mashup name: PTC.PerformanceAnalysis.EmptyDetails_MU
• id value in the MashupConfguration table: PTC.PerformanceAnalysis.EmptyDetails
• For more information, see Empty Details Mashup.
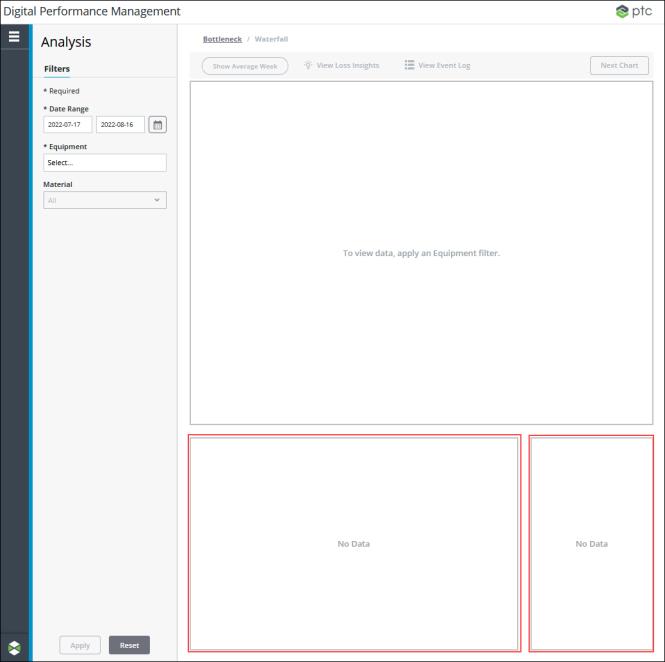
Empty Waterfall Mashup
• Original mashup name: PTC.PerformanceAnalysis.EmptyWaterfall_MU
• id value in the MashupConfguration table: PTC.PerformanceAnalysis.EmptyWaterfall
• For more information, see Empty Waterfall Mashup.
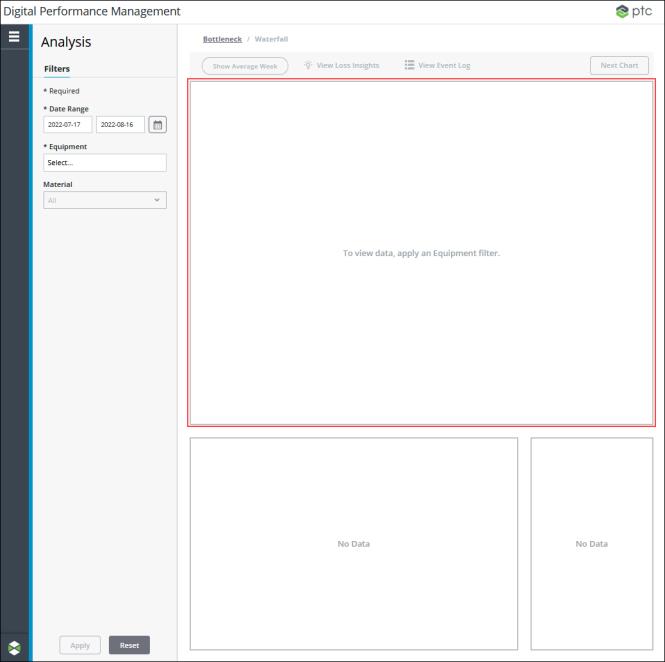
Pareto Chart Mashup
• Original mashup name: PTC.PerformanceAnalysis.Pareto_MU
• id value in the MashupConfiguration table: PTC.PerformanceAnalysis.Pareto
• For more information, see Pareto Chart Mashup.
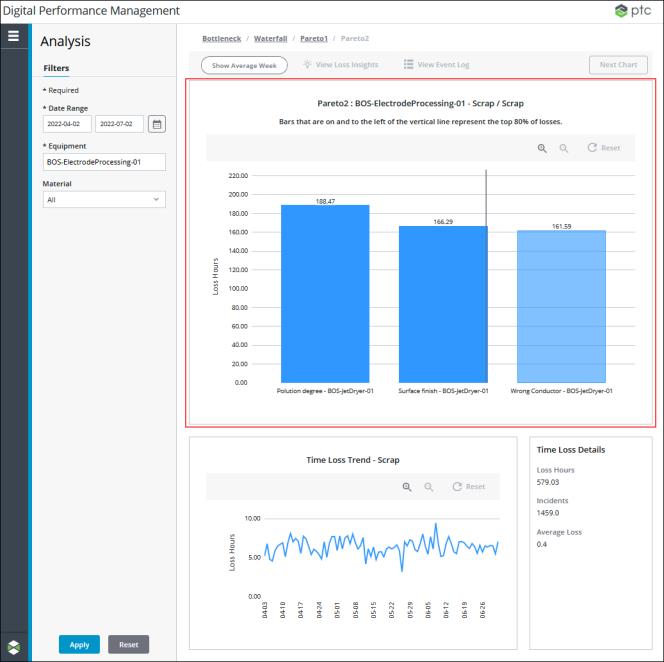
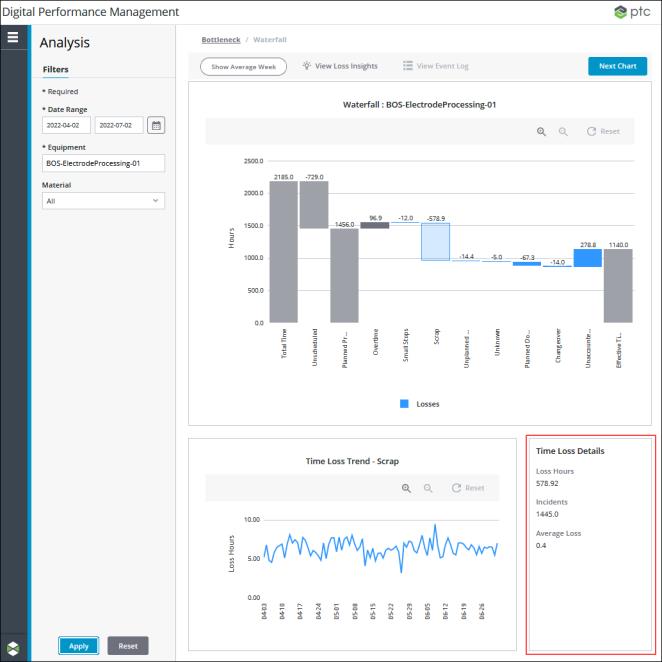
Time Loss Panel Mashup
• Original mashup name: PTC.PerformanceAnalysis.TimeLossPanel_MU
• id value in the MashupConfguration table: PTC.PerformanceAnalysis.TimeLoss
• For more information, see Time Loss Panel Mashup.
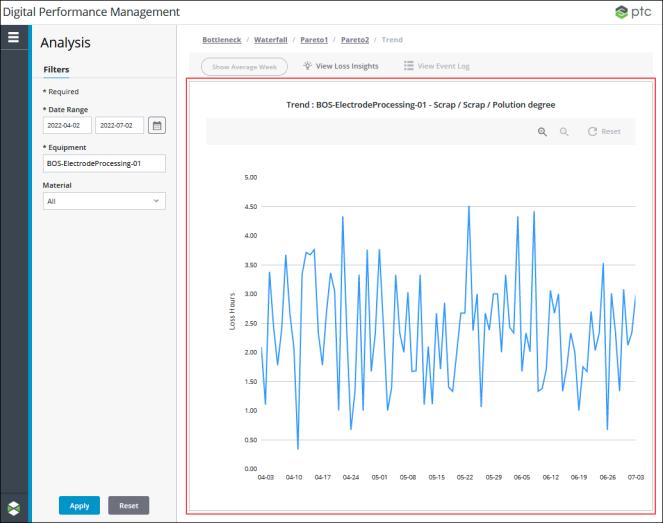
Trend Chart Mashup
• Original mashup name: PTC.PerformanceAnalysis.Trend_MU
• id value in the MashupConfiguration table: PTC.PerformanceAnalysis.Trend
• For more information, see Trend Chart Mashup.
Waterfall Chart Mashup
• Original mashup name: PTC.PerformanceAnalysis.Waterfall_MU
• id value in the MashupConfiguration table: PTC.PerformanceAnalysis.Waterfall
• For more information, see Waterfall Chart Mashup.
