Running Transient Structural Studies
You can run transient structural analyses in Creo Ansys Simulation to study the dynamic response of a structure when a time-varying load is applied to it. You can define loads for transient studies as a function of time using a table function and study the effects of this load on the resultant displacements, deformation, stresses and strains in the model. A transient structural analyses uses a lot of computing resources. It should only be used when the inertia or damping effects in the structure are considered important under the time scale of loading. For cases where inertia and damping effects are not important consider using a static analysis instead.
You can modify the damping settings for a study on the Solver Settings dialog box.
You can also modify the settings that control the selection of substeps on the Solver Settings dialog box.
Example: Running a Transient Structural Study
The following example demonstrates how to set up and run a transient structural study and study the effects of a time-varying load on the results.
1. Consider a steel cantilever beam as shown in the following figure.
1. A fixed constraint is applied to one end of the beam.
2. A time-varying load (table function) is applied to the opposite end of the beam.
2. Click > and then select  Structure as the simulation type, to create a structural simulation study.
Structure as the simulation type, to create a structural simulation study.3. For the active structural study click > and then select the Transient Mode check box.
4. Apply a fixed constraint to one end surface of the beam.
5. Click >  Force to open the Force Load dialog box.
Force to open the Force Load dialog box.Perform the following steps to apply a time-varying load to the other end of the beam.
a. Select the end surface opposite to the constrained surface as the reference to which the load is applied.
b. Right-click the Y- directional component field and select Function to open the Functions dialog box.
c. Click  to open the Function Definition dialog box.
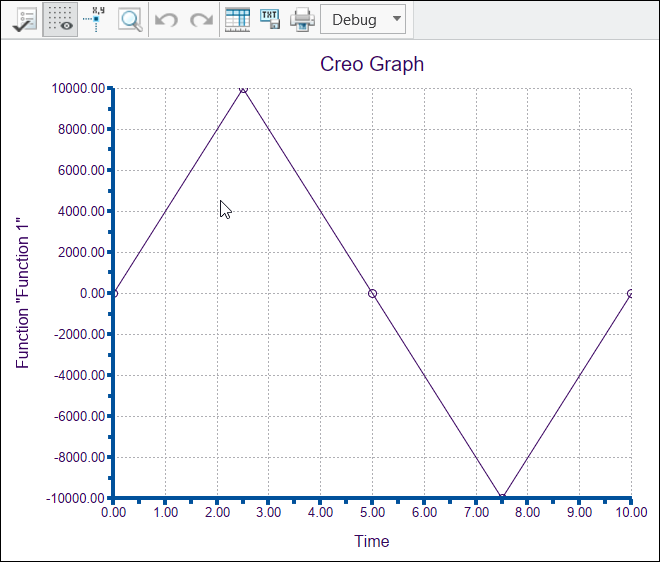
to open the Function Definition dialog box.d. Click  to add rows to the table. Specify the following values of time and load value in the table, to define a time-varying load function.
to add rows to the table. Specify the following values of time and load value in the table, to define a time-varying load function.Time(sec) | Value(N) |
|---|---|
0 | 0 |
2.5 | 10000 |
5 | 0 |
7.5 | -10000 |
10 | 0 |
e. Click Preview to verify a graph of the force load function.
f. Click OK on the Function Definition dialog box to create the function.
g. On the Force Load dialog box select N (Newton) as the units and then click OK to create the force load.
6. Click > to open the Contour Plot dialog box. Select the part as the reference and Von Mises Stress from the Results type list. An advanced result for Von Mises stress is added to Model Tree under the  Results > node.
Results > node.7. Click >  Run to run the transient structural study.
Run to run the transient structural study. ).
).9. When the study is complete, from the Model Tree select the advanced result for Von Mises stress and click  to activate it.
to activate it.10. From the mini toolbar for Results , click the arrow next to  to open the Substep Results control. Move the slider to view the results at different substeps. These are the results of Von Mises stress at 2.5, 5, 7.5, and 10 seconds.
to open the Substep Results control. Move the slider to view the results at different substeps. These are the results of Von Mises stress at 2.5, 5, 7.5, and 10 seconds.Von Mises Stress at 2.5 sec | Von Mises Stress at 5 sec | Von Mises Stress at 7.5 sec | Von Mises Stress at 10 sec |
|---|---|---|---|
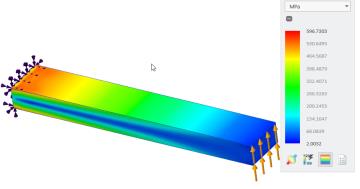 Stress is maximum. | 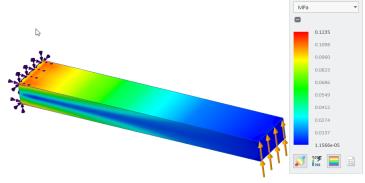 Stress is close to 0. | 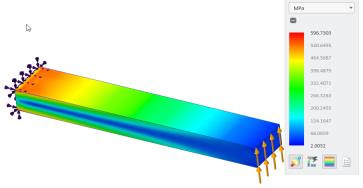 Stress is maximum. | 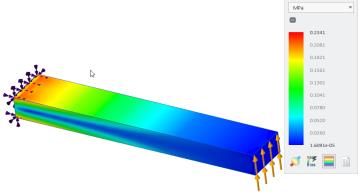 Stress is close to 0. |
11. Click  Minimum Chart and Maximum Chart on the Results mini toolbar to view graphs of the minimum and maximum values of Von Mises stress against time. The following figure shows the graph for maximum values of Von Mises stress over time.
Minimum Chart and Maximum Chart on the Results mini toolbar to view graphs of the minimum and maximum values of Von Mises stress against time. The following figure shows the graph for maximum values of Von Mises stress over time.Similarly, you can study the effect of the load at different time on other result quantities.