Viewing Creo+ License Usage Metrics Based on Users
You can view the metrics for the Creo+ license usage based on users consuming the License to Run, Shared Licenses to Run, or Extension licenses.
As an Administrator, perform the following steps to view the user consumption metrics for the Creo+ license types:
1. Select Telemetry on the left pane. The Creo+ Usage page is displayed.
This page provides the visual tools to view the Creo+ license usage metrics according to users, floating licenses, or geography.
2. Select the Users tab.
3. Select one of the following:
◦ Licenses to Run to view the user consumption metrics for the License to Run licenses.
◦ Shared Licenses to Run to view the user consumption metrics for the Shared License to Run licenses.
◦ Extension to view the user consumption metrics for the Extension licenses.
Licenses to Run Tab
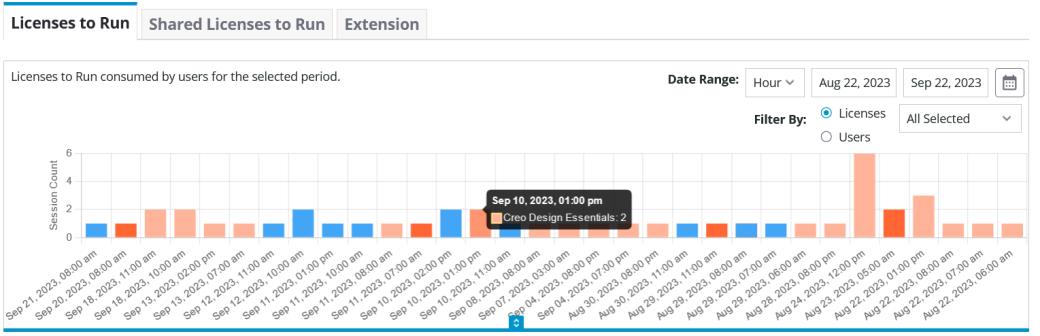
The Licenses to Run tab displays the user consumption metrics for the License to Run licenses. The License to Run license includes the Named Licenses and Shared Licenses.
The Licenses to Run consumed by users for the selected period bar graph displays information about usage of licenses and users within the selected date range. Use the Licenses (default) or Users filter to categorize the corresponding information in the bar graph. You can further select the name of specific licenses or users within the selected date range. If you apply the Licenses filter and place the pointer over a bar in the bar graph, the bar indicates the name of the Creo+ licenses and the number of sessions created for the corresponding licenses. If you apply the Users filter and place the pointer over a bar in the bar graph, the bar indicates the name of users and the number of sessions created for the corresponding users. The Users filter displays all users of your organization in a list. Only the users who created sessions during the selected period are preselected in the list.
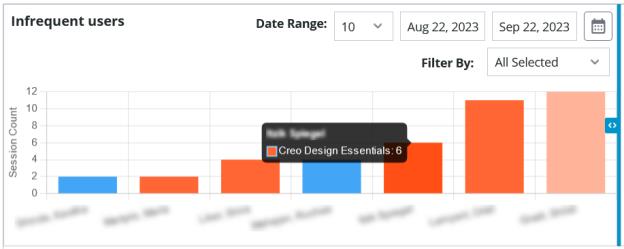
The Infrequent users bar graph displays information about users who use the assigned License to Run licenses infrequently within the selected date range. Use the list next to Date Range: for selecting the maximum number of users that you want to display in the bar graph. You can also filter specific licenses to view the users whose frequency of assigned Creo+license usage is less. When you place the pointer over a bar in the bar graph, the bar indicates the name of a user and the licenses associated with the user. The bar also indicates the number of sessions created for the various licenses.
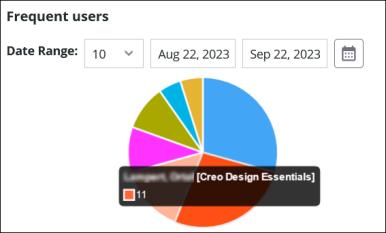
The Frequent users pie chart displays information about users who use the Named Licenses frequently within the selected date range. Use the list next to Date Range: for selecting the maximum number of users that you want to display in the pie chart. When you place the pointer over a slice in the pie chart, the slice indicates the name of a user and the Named license associated with the user. The slice also indicates the number of sessions created for the license associated with the user.
Shared Licenses to Run Tab
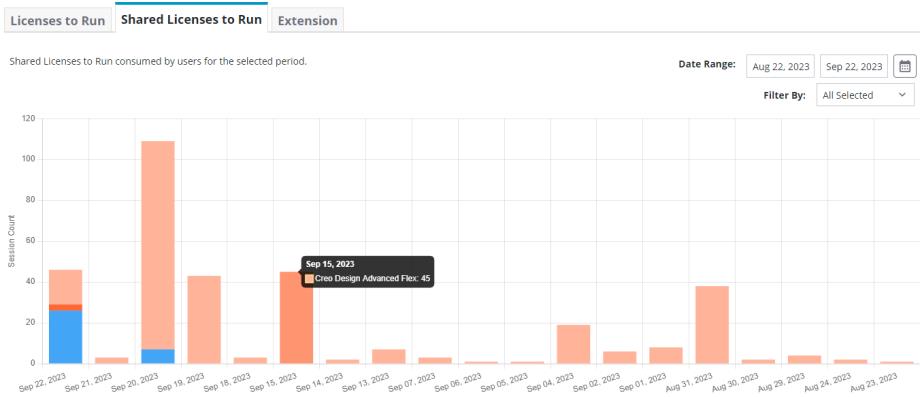
The Shared Licenses to Run tab displays the user consumption metrics for the Shared License to Run licenses.
The Shared Licenses to Run consumed by users for the selected period bar graph displays information about usage of the shared licenses within the selected date range. You can also filter specific shared licenses within the selected date range. When you place the pointer over a bar in the bar graph, the bar indicates the number of sessions created for the corresponding licenses.
Extension Tab
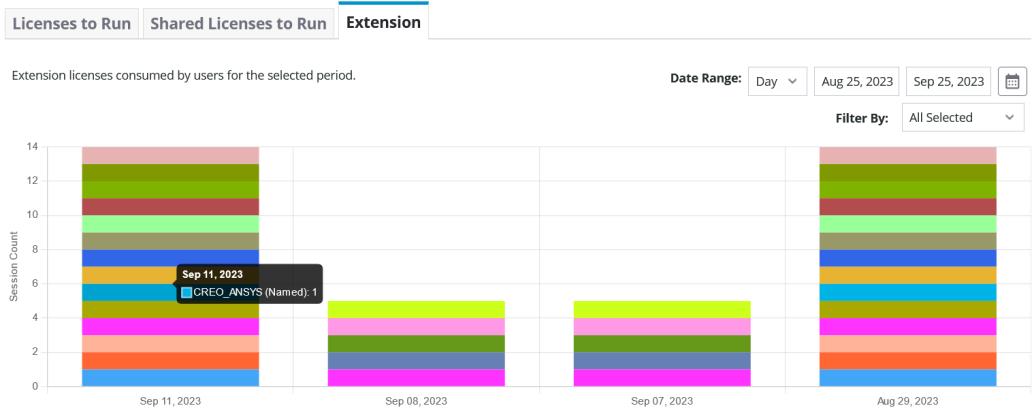
The Extension tab displays the user consumption metrics for the Named Extension licenses.
The Extension licenses consumed by users for the selected period bar graph displays information about the usage of Named Extension licenses within the selected date range. When you place the pointer over a bar in the bar graph, the bar indicates the name of various licenses and the number of sessions created for the corresponding licenses. You can also filter specific extensions within the selected date range.