Monitoring Creo Sessions
Use the Sessions Monitor tool to monitor non-responsive Creo sessions. Perform the following steps if you want to collect diagnostic data for a session, or end a session that has stopped responding.
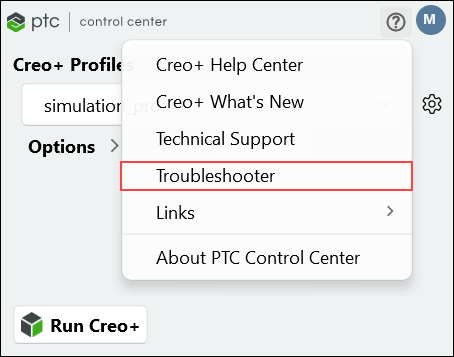
1. From the PTC Control Center click  and then click Troubleshooter to open the Troubleshooter tool.

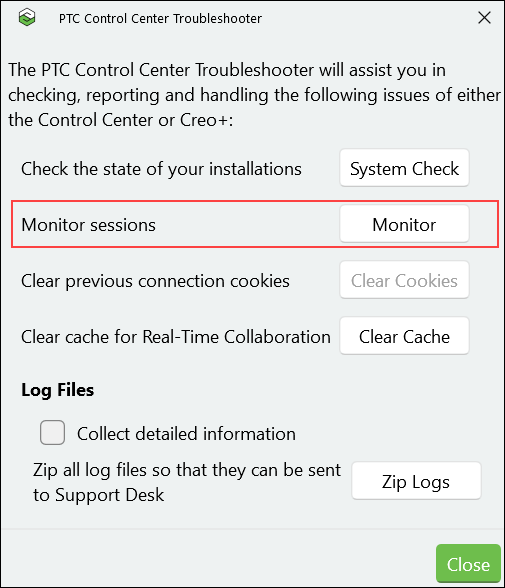
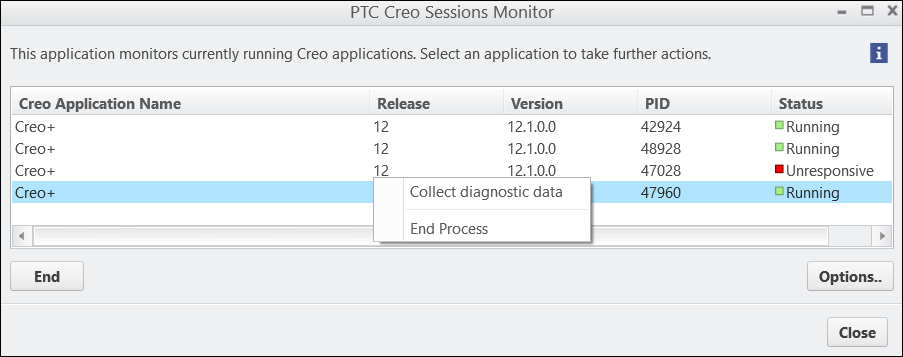
2. Click Monitor to open the PTC Creo Sessions Monitor window that displays all the active sessions. The Status column indicates whether a session is active and running or is non-responsive:
Click Options to view or change any of the settings for the Sessions Monitor.
3. Right-click a non-responsive session and then click End Process to end the session.
Right-click a session and then click Collect diagnostic data to save the diagnostic data to a log folder. By default, the diagnostic data is saved to <user_home>\AppData\Local\PTC\Creo\Logs\diagnostic_data_<date_time_stamp>_Creo+<user_name>. You can share this folder with your Administrator or PTC Technical Support if required.
Setting Options for the Sessions Monitor
Modify the options that govern the type of diagnostics that are collected. Click Options to open the PTC Creo Sessions Monitor Options dialog box.
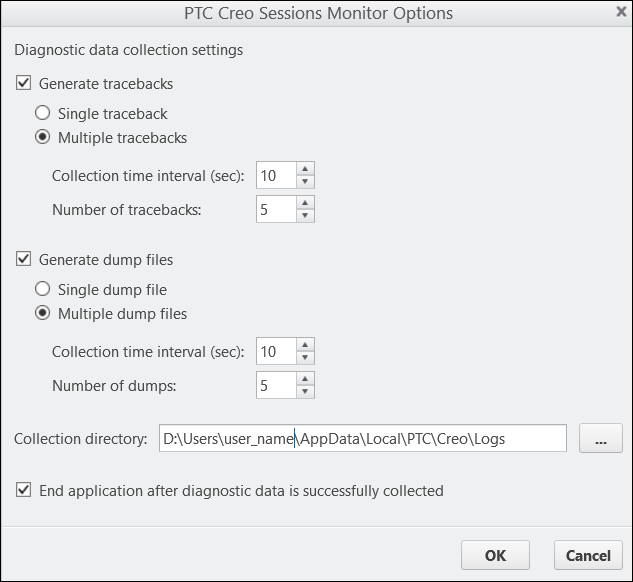
You must select at least one of the two diagnostic collection methods. PTC Technical Support can advise you about which of these options to select:
• Generate tracebacks—Select this check box to collect the call stack from the application— this is the sequence of calls made on all threads of an application. Traceback files are text log files that are used to debug failing applications or crashes. Select either of the following options:
◦ Single traceback—Generates a single file from each traceback source such as bootstrapper, creoagent, xtop etc.
◦ Multiple tracebacks—Generates multiple files from each traceback source.
▪ Collection time interval (sec)—Specifies the time interval in seconds between collection of tracebacks.
▪ Number of tracebacks—Specifies the number of tracebacks generated from each traceback source.
• Generate dump files—Select this check box to collect mini-dumps. A mini-dump file is a stripped down version of the output generated using the Windows SysInternals ProcDump utility. Select either of the following options:
◦ Single dump file—Generates one file from each dump source such as bootstrapper, creoagent, xtop etc.
◦ Multiple dump files—Generates multiple dump files from each dump source.
▪ Collection time interval (sec)—Specifies the time interval in seconds between collection of mini-dumps.
▪ Number of dumps—Specifies the number of dumps created from each dump source.
• Collection directory—Specifies the location of the generated diagnostic data log files. By default the logs are at the location—<driveletter>:\Users\<username>\AppData\Local\PTC\Creo\Logs.
If you change this default location, then the diagnostic data logs are not added to the zipped folder when using the Zip logs button on the Troubleshooter dialog box. |
• End application after diagnostic data is successfully collected—Select this check box to automatically end a session after collecting diagnostic data.