User Page
For each user there is a page with details about the software and hardware configuration of the machines used, the number of sessions, session durations and other metrics. If a specific user is experiencing issues with a unexpected exits, you can access the recommendations to resolve the issue from the Recommendations tab.
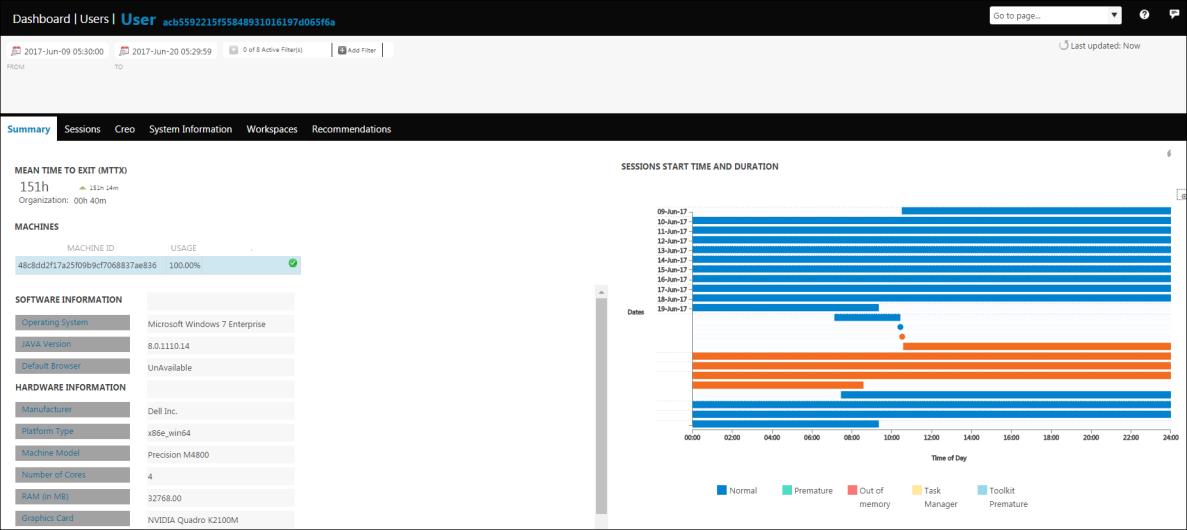
The graph on the Summary tab displays the start, end, and duration for each session, the exit time, and the available recommendations. The recommendations are represented by triangles in the graph. Place the pointer on a triangle to view a summary of all the recommendations available on the Recommendations tab for this user or to open the Recommendation page for this incident.
The MACHINES table lists the machines on which this user has worked. When  appears next to a machine id, the machine is compliant with PTC certified hardware configurations.
appears next to a machine id, the machine is compliant with PTC certified hardware configurations.If hardware compatibility issues are detected for a release of Creo used on the machine, then the issue appears in red and is followed by  . Place the pointer on
  to read the error message. Click the Notifications link in the message or the Recommendations tab to review the suggested solution to resolve these issues.
. Place the pointer on to read the error message. Click the Notifications link in the message or the Recommendations tab to review the suggested solution to resolve these issues.The Sessions tab contains a graphical representation of the percentage of sessions for each exit type.
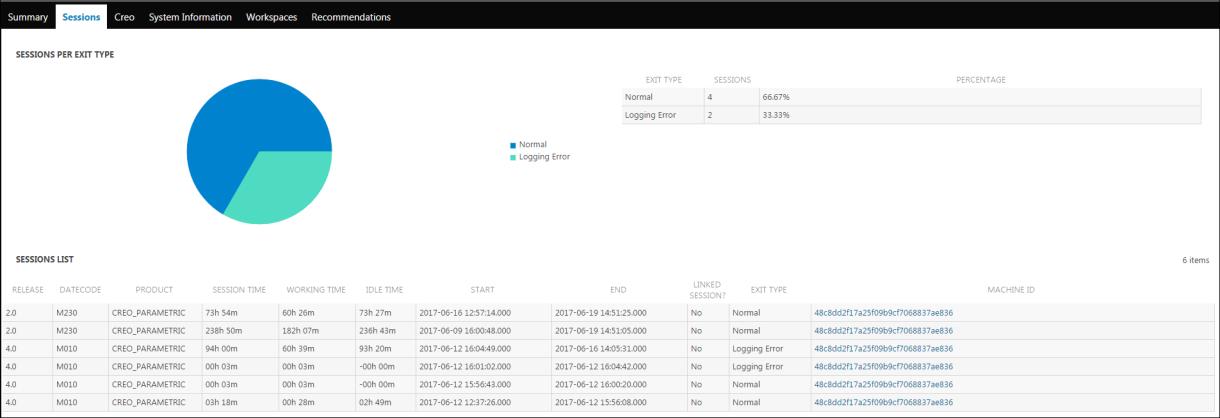
The SESSIONS LIST table displays the details of the Creo applications, their releases and datecodes and the duration of sessions. It also displays IDs of the machine on which the user ran these sessions. Click MACHINE ID to open the Machine Page.
The PTC Creo tab displays details of session usage for the Creo applications.
The System Information tab displays the hardware, software, and graphics information. If hardware compatibility issues are detected for a particular release of Creo used on the machine, then the issue appears in red and is followed by  . Place the pointer on
  to read the error message. Click the Notifications link in the message or the Notifications tab to review the suggested solution to resolve these issues.
. Place the pointer on to read the error message. Click the Notifications link in the message or the Notifications tab to review the suggested solution to resolve these issues.The Workspaces tab provides information about the workspaces owned by the user. For every workspace, details about the server ID, size of workspace, cache size, percentage of cache space used, and date when the workspace was last accessed are listed. If the percentage of cache space used exceeds the specified value, it is indicated a warning symbol  appears. Additionally, for every workspace, the number of checked-out documents, and new and modified checked in documents are also listed.
appears. Additionally, for every workspace, the number of checked-out documents, and new and modified checked in documents are also listed.The Recommendations tab displays a summary of recommendations available for your environment and information to help you decide on the priority of the updates.
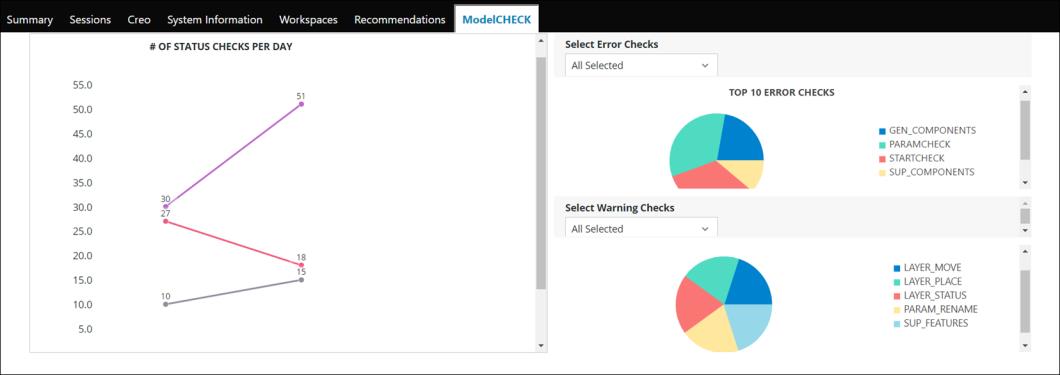
The ModelCHECK tab provides graphical representation of the number of results per day for each status type, top 10 error checks, and top 10 warning checks for the ModelCHECK user.