RBD Diagram Pane
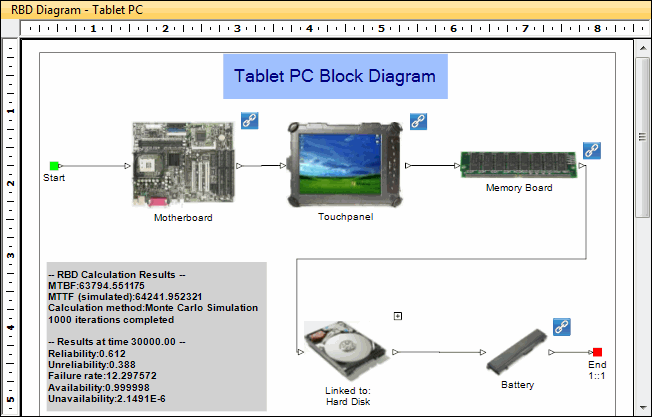
The RBD Diagram pane displays the diagram selected in the RBD Table. The value specified as the identifier for this diagram is shown in the title bar. For example, the following figure is the Tablet PC diagram from the Tablet PC Sample Project. This diagram shows how sophisticated your block diagrams can be. In this diagram, the blocks, which use custom image files, link to other items in the System file or to other block diagrams. This diagram also displays system-level calculation results.

When you select a record for a newly inserted block diagram in the RBD Table, only a start node and end node are shown in the RBD Diagram pane.

To construct a new block diagram, you insert blocks, connectors, and junctions in the diagram. You can also insert labels to provide supplementary information that might be needed or is helpful. For more information, see Block Diagram Objects.
The following figure shows a diagram with six blocks in the default block style. You can specify what the blocks are to look like as well as the properties to show. For more information on diagram construction, see Block Diagram How-Tos.

The blocks in a diagram can have multiple inputs and outputs. The inputs to a block are considered to be in a 1::N parallel configuration. While you can assign priorities when multiple connectors go into a junction, you cannot assign priorities when multiple connectors go into a block.

When you feed multiple inputs into a block without using a junction, the RBD module treats this as a 1::N configuration.
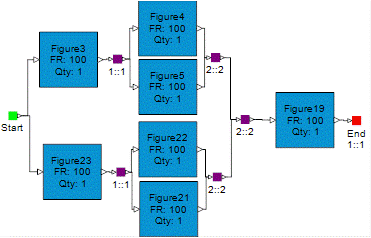
Examples follow for different modeling scenarios that either include or exclude junctions to arrive at different system calculation results. Assume you have the following diagram.

Despite its appearance, all components are required. Consequently, it is a series system that you could represent as shown below.

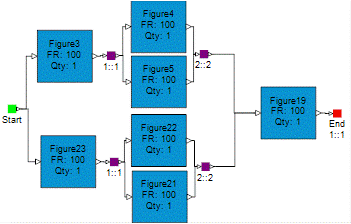
Assume you change the diagram by removing the last junction. In this scenario, the MTBF of the system would increase. This is because the RBD module now sees two separate paths feeding into Figure19. If one path fails, the other patch continues to operate the system. Thus, results are calculated as if a 1::2 junction is in place right before Figure19.

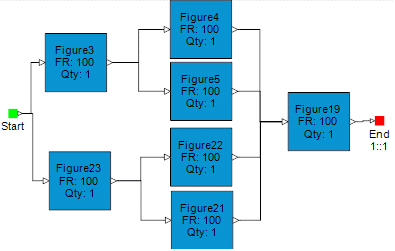
If you remove all junctions, this scenario givens an even higher result for system MTBF. The RBD module now sees four separate paths feeding in Figure 19 from blocks labeled Figure4, Figure5, Figure22, and Figure21. Results are calculated as if a 1::4 junction is in place right before Figure19.

Given these examples, you can see how diagram construction affects calculation results.