KPI Dashboard
General
The main KPI dashboard is accessed from the KPI Dashboard tile on the RTPPM landing page, or KPI Dashboard icon on the vertical menu on the left side.
The KPI Dashboard will only display the most current KPI Thresholds. |
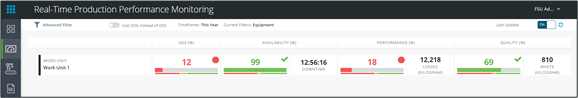
The dashboard provides the following KPI information for the displayed equipment.
• OEE (%)—The overall equipment effectiveness (OEE) percentage. Calculated as: Availability % * Performance % * Quality % / 10,000
• OOE (%)—The overall operation effectiveness (OOE) percentage. Calculated as: OEE * Open Rate where: Open Rate = Available Time / Open Time
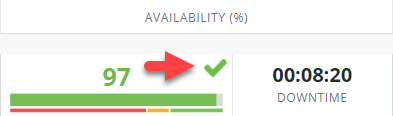
• Availability (%)—The availability percentage and total downtime duration. Calculated as: 100 * Operating Time / Loading Time
• Performance (%)—The performance percentage and total number of losses. Calculated as: 100 * Gross Production / Ideal Production
• Quality (%)—The quality percentage and total amount of waste. Calculated as: 100 * Net Production / Gross Production
Notice that icons appear in the top-right corner of each KPI. These icons provide visual confirmation that reinforces the color coding consistent with the limits configured for the KPI.
• Red – a red octagon will appear
• Yellow – a caution triangle will appear
• Green – a check mark will appear
Security and Permissions
Function/ Screen | Permission | Administrator | Line Manager | Scheduler | Operator | Process Engineer | Plant Manager |
Dashboards | View | X | X | X | X | X | X |
Contents
◦ OEE
◦ OOE
◦ Quality