Downtime Events
General
The Downtime Events Display shows a detailed breakdown of all downtime events that are entered manually by users or created automatically by the system.
The landing page will initially read “To Start, use the Advanced Filter panel”.
The events that are shown in the Downtime Events Display are determined by the advanced filter selections below:
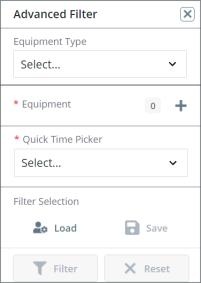
Filtering
• Equipment Type - (Optional) Select one or more equipment types on which to filter the list of equipment.
• Equipment - (Required) Select one or more pieces of equipment.
• Quick Time Picker - (Required) Select a time frame from a list of predefined time frames or set a custom time frame.
• Load – Load saved filter settings.
• Save – Save the current filter settings to be able to load them later.
• Filter – Execute the current filter settings.
• Reset – Clear all filter settings.
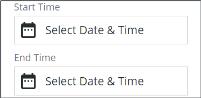
• Start Time and End Time – (Required for Custom Time Range) If the custom option is selected in the Quick Time Picker, you must select the start and end times for the time frame to display.
After making the appropriate filter selections, click Filter to apply the selected filters to the Downtime Events Display.
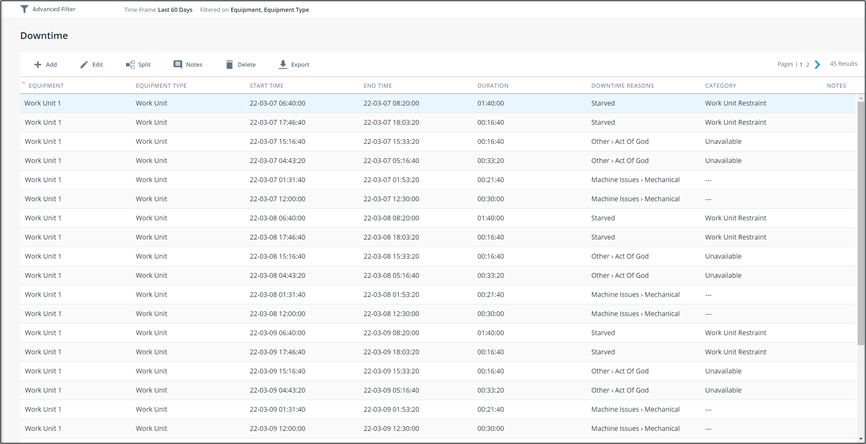
Navigation

Add – Manually add a new downtime event.
Edit – Edit an existing downtime event.
Split – Split an existing downtime event in to two, separate events.
Notes – View all notes associated with a downtime event
Delete – Delete a downtime event.
Export – Export a .xlsx file of all current downtime events results.