Time Series Chart Widget (Legacy)
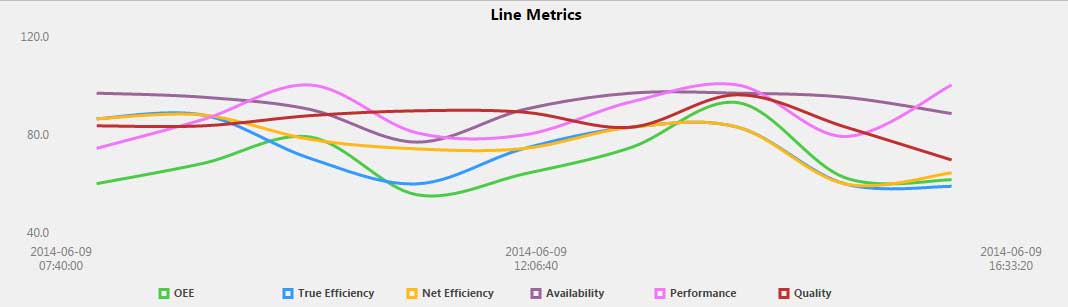
The time series chart is designed for use with time series data where the x-axis is time. This chart only supports line and/or point marker rendering.
It can be used with one or more data service result sets, similar to other multiple pen charts. If you use a single data service, you do not have to configure each series pen. If no other configuration settings are defined, the chart will use the first DATETIME column for the x-axis and plot each numeric value in the result set up to the maximum number of pens.
Properties
For information about common widget properties, see Widgets. Properties that are specific to the Time Series Chart widget are described in the table below.
|
Property Name
|
Description
|
Base Type
|
Default Value
|
Bindable? (Y/N)
|
Localizable? (Y/N)
|
|---|---|---|---|---|---|
|
CustomClass
|
User defined CSS class to apply to the top div of the widget. Multiple classes can be entered, separated by a space.
|
STRING
|
n/a
|
Y
|
N
|
|
SingleDataSource
|
Indicates whether you want to use a single data source for all series (pens). If you want to use different data sources per pen, you must specify the source for each pen.
|
BOOLEAN
|
True
|
N
|
N
|
|
NumberOfSeries
|
Number of series (pens) in the chart
|
NUMBER
|
8
|
N
|
N
|
|
Data
|
Data source to be used in the chart. Use this field for only one data service, or select a data service for each pen.
|
INFOTABLE
|
n/a
|
Y
|
N
|
|
ChartType
|
The chart type on a global level or for an individual series
|
STRING
|
Line
|
N
|
N
|
|
ChartTitle
|
Title of the chart
|
STRING
|
n/a
|
Y
|
Y
|
|
ShowLegend
|
Shows or hides the legend
|
BOOLEAN
|
True
|
N
|
N
|
|
LegendWidth
|
Fixed legend width. If non-zero, this value is used.
|
NUMBER
|
0
|
N
|
N
|
|
LegendLocation
|
If value is null, the legend does not appear.
|
STRING
|
Right
|
N
|
N
|
|
LegendOrientation
|
Displays the legend vertically or horizontally
|
STRING
|
Vertical
|
N
|
N
|
|
MarkerSize
|
Size of the markers on the chart
|
NUMBER
|
3
|
N
|
N
|
|
MarkerType
|
Shape of the markers
|
STRING
|
Circle
|
N
|
N
|
|
Smoothing
|
Turns line smoothing on
|
BOOLEAN
|
false
|
N
|
N
|
|
XAxisField
|
Field that displays X-axis values
|
n/a
|
n/a
|
Y
|
N
|
|
ShowXAxis
|
Shows or hides the X-axis
|
BOOLEAN
|
True
|
N
|
N
|
|
XAxisFormat
|
Format for the X-axis values
|
STRING
|
yyyy-MM-dd HH:mm:ss
|
N
|
N
|
|
XAxisMinimum
|
Minimum range for the X-axis
|
NUMBER
|
n/a
|
Y
|
N
|
|
XAxisMaximum
|
Maximum range for the X-axis
|
NUMBER
|
n/a
|
Y
|
N
|
|
XAxisAutoscale
|
Automatically scales the X-axis
|
BOOLEAN
|
True
|
N
|
N
|
|
XAxisZeroscale
|
Forces a zero minimum when automatically scaling the X-axis
|
BOOLEAN
|
False
|
N
|
N
|
|
XAxisSmoothScaling
|
Attempts to use round values to scale the X-axis
|
BOOLEAN
|
True
|
N
|
N
|
|
XAxisIntervals
|
Number of X-axis chart intervalsAffects ticks and grids
|
NUMBER
|
10
|
N
|
N
|
|
XAxisMinorTicks
|
Number of X-axis minor ticks
|
NUMBER
|
1
|
N
|
N
|
|
XAxisLabels
|
Number of X-axis labels
|
NUMBER
|
2
|
N
|
N
|
|
AllowXAxisZoom
|
Allows zooming on the X-axis
|
BOOLEAN
|
True
|
N
|
N
|
|
ShowXAxisLabels
|
Shows or hides X-axis labels
|
BOOLEAN
|
True
|
N
|
N
|
|
ShowXAxisTicks
|
Shows or hides X-axis ticks
|
BOOLEAN
|
True
|
N
|
N
|
|
ShowYAxis
|
Shows or hides the Y-axis
|
BOOLEAN
|
True
|
N
|
N
|
|
YAxisMode
|
Use of single, dual, or multipleY-axes
|
STRING
|
Single Y Axis
|
N
|
N
|
|
YAxisIntervals
|
Number of Y-axis chart intervals for large ticksAffects ticks and grids
|
NUMBER
|
10
|
N
|
N
|
|
YAxisMinorTicks
|
Number of Y-axis minor ticks between intervals
|
NUMBER
|
1
|
N
|
N
|
|
YAxisLabels
|
Number of intervals for a Y-axis label
|
NUMBER
|
2
|
N
|
N
|
|
ShowYAxisLabels
|
Shows or hides Y-axis labels
|
BOOLEAN
|
True
|
N
|
N
|
|
ShowYAxisTicks
|
Shows or hides Y-axis tick marks
|
BOOLEAN
|
True
|
N
|
N
|
|
AllowYAxisZoom
|
Allows zooming on the Y-axis
|
BOOLEAN
|
True
|
N
|
N
|
|
YAxisFormat
|
Format for Y-axis values
|
STRING
|
0000.0
|
N
|
N
|
|
YAxisMinimum
|
Minimum range for the Y-axis
|
NUMBER
|
0
|
Y
|
N
|
|
YAxisMaximum
|
Maximum range for the Y-axis
|
NUMBER
|
100
|
Y
|
N
|
|
YAxisAutoscale
|
Automatically scales the Y-axis
|
BOOLEAN
|
True
|
N
|
N
|
|
YAxisZeroscale
|
Forces a zero minimum when automatically scaling the Y-axis
|
BOOLEAN
|
False
|
N
|
N
|
|
SecondaryYAxisFormat
|
Format for the secondary Y-axis values
|
STRING
|
0000.0
|
N
|
N
|
|
SecondaryYAxisMinimum
|
Minimum range for the secondary Y-axis
|
NUMBER
|
0
|
Y
|
N
|
|
SecondaryYAxisMaximum
|
Maximum range for the secondary Y-axis
|
NUMBER
|
100
|
Y
|
N
|
|
SecondaryYAxisAutoscale
|
Automatically scales the secondary Y-axis
|
BOOLEAN
|
True
|
N
|
N
|
|
SecondaryYAxisZeroscale
|
Forces a zero minimum when automatically scaling the secondary Y-axis
|
BOOLEAN
|
False
|
N
|
N
|
|
AllowSelection
|
Allows item selection
|
BOOLEAN
|
True
|
N
|
N
|
|
EnableHover
|
Displays values when hovering over
|
BOOLEAN
|
True
|
N
|
N
|
|
ShowXAxisGrid
|
Shows the horizontal grid
|
BOOLEAN
|
True
|
N
|
N
|
|
ShowYAxisGrid
|
Shows the vertical grid
|
BOOLEAN
|
True
|
N
|
N
|
|
DataSource1 through DataSource16
|
Series data sources 1–16Data source used for series (pens)This field is used only if SingleDataSource is false.
|
INFOTABLE
|
n/a
|
Y
|
N
|
|
DataField1 through DataField16
|
Series data fields 1–16The data column from DataSourceN is used as the value field.
|
n/a
|
n/a
|
Y
|
N
|
|
DataLabel1 through DataLabel16
|
Series data labels 1–16The data column from DataSourceN is used as the label field.
|
STRING
|
n/a
|
Y
|
Y
|
|
XAxisField1 through XAxisField16
|
Series X-axis fields 1–16The data column from DataSourceN is used as the X-axis field.
|
n/a
|
n/a
|
Y
|
N
|
|
SeriesType1 through SeriesType16
|
Rendering type for the series (such as line). Use Chart Settings defaults to ChartType property setting.
|
STRING
|
Use Chart Settings
|
N
|
N
|
|
SeriesMarkerType1 through SeriesMarkerType16
|
Series-specific marker type
|
STRING
|
Use Chart Settings
|
N
|
N
|
|
UseSecondaryAxis1 through UseSecondaryAxis16
|
Shows or hides the secondary Y-axis
|
BOOLEAN
|
False
|
N
|
N
|
|
SeriesDataStyle1 through SeriesDataStyle16
|
Series data style
|
n/a
|
State Formatting
|
N
|
N
|