Label Chart Widget (Legacy)
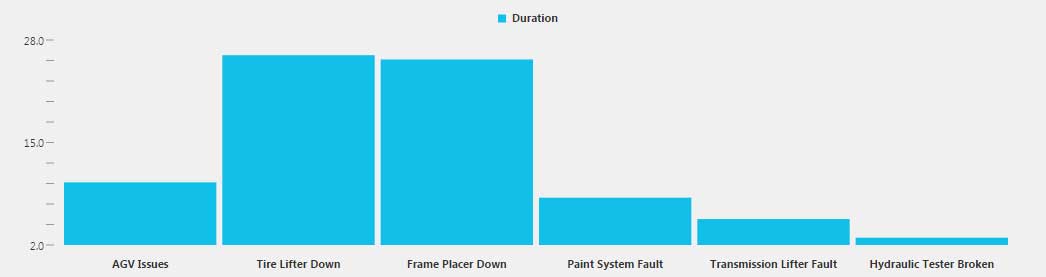
The label chart is used when you want to use specific labels for the x-Axis. This includes bar charts, horizontal bar charts, line, marker and line marker charts, and area charts.
The bar, lines, and markers support styling, as well as state formatting based on data values. The area charts do not support data driven state formatting, only styles.
|
|
Styles and common widget properties are not included in the table below.
|
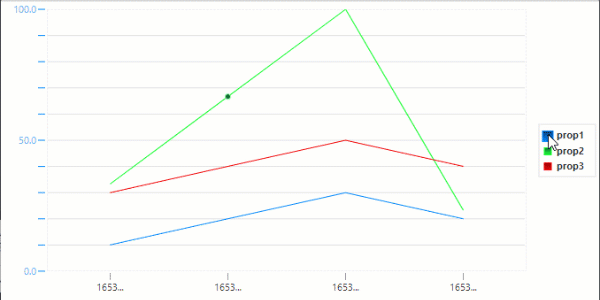
Overlaying Multiple Y Axes
By default, all Y-axes are displayed side by side, which uses more space in the layout and can make it difficult to associate a data series with its axis.
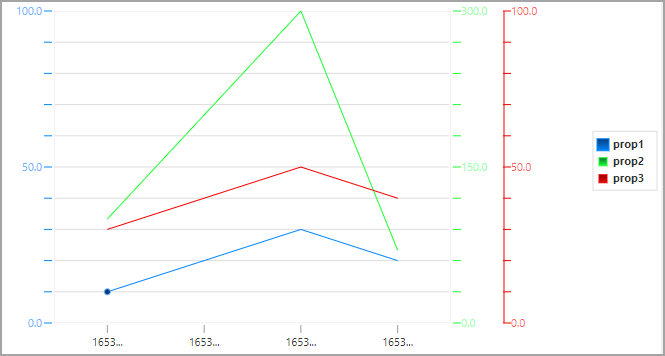
You can display one axes at a time by enabling the OverlayYAxes property. At run time, users can select the axes to display by clicking a data series in the legend.
Property Name | Description | Base Type | Default Value | Bindable? (Y/N) | Localizable? (Y/N) | ||
|---|---|---|---|---|---|---|---|
CustomClass | User defined CSS class to apply to the top div of the widget. Multiple classes can be entered, separated by a space. | STRING | n/a | Y | N | ||
SingleDataSource | Use a Single Data Source for All Series. If you want to use different data sources, you must specify the source for each pen individually. | BOOLEAN | True | N | N | ||
NumberOfSeries | Desired number of series (pens) in this chart. | NUMBER | 8 | N | N | ||
Data | Data source to be used in the chart (this field is used only if one data service is used, otherwise you need to select the data service per pen). | INFOTABLE | n/a | Y | N | ||
ChartType | Selectable on a global level as well as for an individual series (Bar, Line, Line/Marker, Marker, Area, Area/Marker). | STRING | Bar | N | N | ||
StackSeries | Stack series for bar and area-type charts. | BOOLEAN | False | N | N | ||
ChartOrientation | Vertical or Horizontal orientation.
| BOOLEAN | Vertical | N | N | ||
ChartTitle | The title of the chart. | STRING | n/a | Y | N | ||
ShowLegend | Display the chart’s legend. | BOOLEAN | True | N | N | ||
LegendWidth | The width of the chart’s legend. | NUMBER | 0 | N | N | ||
LegendLocation | The location of the chart’s legend (Right, Top, Bottom, or Left). | STRING | Right | N | N | ||
LegendOrientation | Desired legend orientation (Vertical or Horizontal). | STRING | Vertical | N | N | ||
MarkerSize | The desired marker size. | NUMBER | 3 | N | N | ||
MarkerType | The desired type of marker (circle, square, triangle, diamond, or image). | STRING | Circle | N | N | ||
Smoothing | Optional line smoothing. | BOOLEAN | False | N | N | ||
XAxisField | The data column from the Data source that provides the x-axis values. | MENUNAME | n/a | Y | N | ||
ShowXAxis | Show or hide the x axis. | BOOLEAN | True | N | N | ||
XAxisFormat | Format for the x-axis values. | STRING | 0000.0 | N | N | ||
XAxisLabelType | Format for the x-axis labels (String, Numeric, or Date/Time). | STRING | String | N | N | ||
XAxisLabelRotation | Label rotation (in degrees) for X axis value labels. | NUMBER | 0 | N | N | ||
ShowXAxisLabels | Display or hide the x-axis labels. | BOOLEAN | True | N | N | ||
ShowXAxisTicks | Display or hide the x-axis tick marks. | BOOLEAN | True | N | N | ||
XAxisTitle | The displayed title for the x-axis. | STRING | n/a | Y | Y | ||
YAxisTitle | The displayed title for the y-axis. | STRING | n/a | Y | Y | ||
SecondaryXAxisTitle | Title to display for a secondary x-axis. | STRING | n/a | N | N | ||
OverlayYAxes | Overlays all Y axes on the widget. When this property is enabled, users can select the axes to display by clicking a data series in the legend. When the property is disabled. y axes are displayed side by side.
| BOOLEAN | False | N | Y | ||
ShowYAxis | Display or hide the y-axis. | BOOLEAN | True | N | N | ||
YAxisMode | The display mode for the y-axis (Single Y Axis, Dual Y Axis, or Multiple Y Axis).
| STRING | Single Y Axis | N | N | ||
ShowYAxisLabels | Display or hide the y-axis labels. | BOOLEAN | True | N | N | ||
ShowYAxisTicks | Display or hide the y-axis label tick marks. | BOOLEAN | True | N | N | ||
YAxisFormat | Format for the y-axis vales. | STRING | 0000.0 | N | N | ||
YAxisIntervals | The number of y-axis chart intervals (affects tick marks and grid). | NUMBER | 10 | N | N | ||
YAxisMinorTicks | The number of y-axis minor ticks. | NUMBER | 1 | N | N | ||
YAxisLabels | The number of y-axis labels. | NUMBER | 2 | N | N | ||
AllowYAxisLabelZoom | Allow y-axis label zoom. | BOOLEAN | True | N | N | ||
YAxisMinimum | The minimum value for the y-axis | NUMBER | 0 | Y | N | ||
YAxisMaximum | The maximum value for the y-axis. | NUMBER | 120 | Y | N | ||
YAxisAutoscale | Allow autoscaling for the y-axis. | BOOLEAN | True | N | N | ||
YAxisZeroscale | Forces a zero minimum when automatically scaling for the y-axis. | BOOLEAN | False | N | N | ||
SecondaryYAxisFormat | Format for the secondary y-axis values. | STRING | 0000.0 | N | N | ||
SecondaryYAxisMinimum | Minimum value for the secondary y-axis. | NUMBER | 0 | Y | N | ||
SecondaryYAxisMaximum | Maximum value for the secondary y-axis. | NUMBER | 100 | Y | N | ||
SecondaryYAxisAutoscale | Automatically scale the y-axis. | BOOLEAN | True | N | N | ||
SecondaryYAxisZeroscale | Forces a zero minimum when automatically scaling the secondary y-axis. | BOOLEAN | False | N | N | ||
AllowSelection | Allow item selection. | BOOLEAN | True | N | N | ||
EnableHover | Allow the display of values when hovering over them. | BOOLEAN | True | N | N | ||
ShowXAxisGrid | Display or hide the x-axis grid. | BOOLEAN | True | N | N | ||
ShowYAxisGrid | Display or hide the y-axis grid. | BOOLEAN | True | N | N | ||
DataSource1 | The data source for the chart. | INFOTABLE | n/a | Y | N | ||
DataField1 | The data column from DataSource1 to be used as the value field. | FIELDNAME | n/a | Y | N | ||
DataLabel1 | The label for the DataSource1 data. | STRING | n/a | Y | Y | ||
XAxisField1 | The x-axis field name. | FIELDNAME | n/a | Y | N | ||
SeriesType1 | The display type for the data (Use Chart Settings, Line, Line/Marker, Marker, or Bar). | STRING | Use Chart Settings | N | N | ||
SeriesMarkerType1 | The type of marker for series-specific types of data (Circle, Square, Triangle, Diamond, or Image). | STRING | UseChartSetting | N | N | ||
UseSecondaryAxis1 | Use the secondary y-axis. | BOOLEAN | False | N | N | ||
ShowDataLoading | Displays a spinning icon when data is loading. | BOOLEAN | True | N | N | ||
DoubleClicked | Event. Triggered when the chart is double-clicked. | n/a | n/a | Y | N |