Creating a Pagination Data Service
The Pagination widget is a group of user-interface controls that enable you to paginate data and switch between pages. For example, you can use the widget to display a limited number of rows from a large data set on a Grid widget. When the results per page for an infotable with 30 rows is set to 6, the pagination widget displays five pages. The first page displays rows 1 to 6, and the second page displays rows 7 to 12. However, the widget does not include functionality that enables you to paginate data automatically. To paginate data for widgets such as a grid, you must create a pagination data service with input parameters that you can bind to the Pagination widget. The following topic provides an example on how to paginate a data set that is displayed on a Grid widget.
By default, the grid displays all the data rows that are retrieved from a bound infotable at the same time. Scroll bars appear when the retrieved data set is large, which forces users to scroll up or down to find relevant data, This design can negatively affect the user experience. You can add a pagination widget to control the number of rows that are displayed at the same time. This preserves the mashup layout and makes it easier to find specific values within the data set.
Example: Creating Data Pagination Service
You can retrieve data from the same service or another service. In this example, the data is created and paginated within the same service. However, you can also create two separate data services to create the grid data and to apply pagination. To create the required services and entities for the pagination, perform the following steps:
1. In Composer, create the following entities:
◦ A Thing entity to store the pagination data service.
◦ A data shape to define a parent infotable, which a contains a numeric numberOfRows property and a nested infotable.
◦ A data shape to define the nested infotable, which contains the grid data.
2. Add field definitions to the data shapes that you created in the previous step to define the columns for each infotable.
3. Edit the Thing entity that you created in Step 1, and on the Services tab, click Add.
4. Type a name for the service, and then under Inputs, define the following parameters:
◦ pageNumber—A numeric parameter used to store the current page number.
◦ pageSize—A numeric parameter used to set the number of rows to display on each page.
◦ numberOfResults—A numeric parameter used to specify the total number of rows in the infotable. Set the default value to 100.
◦ query—A query parameter used to store the filter configuration of the Grid Advanced widget.
You can use these input parameters to pass data from the Grid and Pagination widgets to the service.
5. Define a custom service within the code editor to paginate the infotable data. Use the following example as a reference.
6. Click Done, then save the entity.
The following is an example for a pagination service. The first code block defines the two infotables used to store the service data.
let result = Resources["InfoTableFunctions"].CreateInfoTableFromDataShape({
infoTableName: "InfoTable",
dataShapeName: "PaginationInfotable",
});
let GridData = Resources["InfoTableFunctions"].CreateInfoTableFromDataShape({
infoTableName: "InfoTable",
dataShapeName: "WeatherData",
});
infoTableName: "InfoTable",
dataShapeName: "PaginationInfotable",
});
let GridData = Resources["InfoTableFunctions"].CreateInfoTableFromDataShape({
infoTableName: "InfoTable",
dataShapeName: "WeatherData",
});
The second infotable contains the grid data and the first infotable is used to contain both the total number of rows in the nested infotable and the grid data displayed on the grid.
The following code block is used to generate random data values for the infotable rows.
function randomDate(start, end) {
function randomValueBetween(min, max) {
return Math.random() * (max - min) + min;
}
var date1 = start || "01-01-1970";
var date2 = end || new Date().toLocaleDateString();
date1 = new Date(date1).getTime();
date2 = new Date(date2).getTime();
if (date1 > date2) {
return new Date(randomValueBetween(date2, date1)).toLocaleDateString();
} else {
return new Date(randomValueBetween(date1, date2)).toLocaleDateString();
}
}
var rows = numberOfResults;
var num = 1;
var img = "/Thingworx/MediaEntites/sunny";
let dateT = randomDate("01/01/2010", "01/01/2022");
for (var i = 0; i < rows; i++) {
date = randomDate("01/01/2010", "01/01/2022");
if (i % 5 == 1) {
img = "/Thingworx/MediaEntities/cloudy";
} else if (i % 5 == 2) {
img = "/Thingworx/MediaEntities/rain";
} else if (i % 5 == 3) {
img = "/Thingworx/MediaEntities/snow";
}
GridData.AddRow({
number: num,
name: "The result number is:" + i,
date: new Date(dateT),
location: "-75.617798, 40.028035, 0",
image: img,
});
num++;
}
The for loop is used to create infotable rows using random dates with additional values from following variables:
• num—The row number.
• name—A string that shows the zero-based index number of each row.
• date—Contains a random date that is generated using the randomDate function.
• img—Contains a reference to the media entity to display.
• location—A string with location coordinates, separated by a comma.
• rows—A variable that is used to set the number of rows to create for the infotable.
The result is stored in the nested GridData infotable using the AddRow method. To create the parent infotable, with the numberOfResults property, add the following line:
result.AddRow({numberOfResults: rows, GridData: GridData});
The following code block is used to calculate and paginate data rows that are stored in the GridData infotable.
var paginatedResult = Resources["InfoTableFunctions"].CreateInfoTableFromDataShape(params);
var numRows = paginatedInfotable.getRowCount();
var startRow = (pageNumber > 0 ? pageNumber - 1 : 0) * pageSize;
var numAdded = 0;
for (var r = startRow; r < numRows && numAdded < pageSize; r++) {
paginatedResult.addRow(paginatedInfotable.getRow(r));
numAdded++;
}
var numRows = paginatedInfotable.getRowCount();
var startRow = (pageNumber > 0 ? pageNumber - 1 : 0) * pageSize;
var numAdded = 0;
for (var r = startRow; r < numRows && numAdded < pageSize; r++) {
paginatedResult.addRow(paginatedInfotable.getRow(r));
numAdded++;
}
The service should use values from the following input parameters:
• numberOfResults—The total number of results in the data set. This value is used to calculate how many pages are required. You can bind this value from another services, widget, or function.
• resultsPerPage—The number of data rows to include in the infotable for the pagination. This sets the number of results in each page.
• currentPage—The current page number, which is used to determine the range of data rows to display from the full data set.
At run time, when the page number changes, the PageNumberChanged event is triggered. You can calculate the rows to display on each page using the following values:
• The current page number
• The number of results to display on each page
• The total number of results
The pagination service is used to calculate the index number of the first row on each page. This sets the starting row for the current page number. To calculate the first row to display on each page, subtract 1 from the current page number, and then multiply the result with the page size value. When results are displayed on more than one page, the index is calculated in the following way:
startRow = pageNumber - 1 * pageSize
Use a for loop to go over each row in the data, starting with the current index, and then increment using a variable that counts the total number of results to display on the page. The total number value is an input parameter that you can also bind as an output to the Pagination widget. When the numAdded variable reaches the defined value for the number of results, the loop exits.
In this example, the grid displays 100 rows that are returned from the data service infotable. The number of results to display on each page is 10. When the page number changes, the data service then returns an infotable with a unique set of rows, depending on the current page number.
|
|
You can paginate data that is retrieved from other services using an infotable input parameter. In this current example, the data is loaded initially within the same data service.
|
The last code block saves the paginated data rows to the nested infotable by assigning the paginatedResult values to the GridData variable.
GridData = paginatedResult;
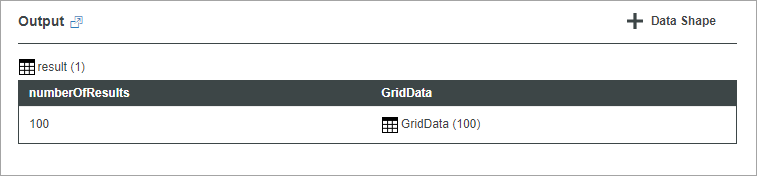
The returned infotable is now updated based on the page size and current page number. The following image shows the infotable content when the numberOfResults is set to 100.
Adding the Pagination Service to the Mashup
1. Click + on the Data panel.
2. On the left pane, select the entity that contains the pagination data service.
3. Add the data service to the list of the selected service on the right pane.
4. Select the Execute on Load check box to execute the data service when the mashup is loaded initially at run time.
5. Click Done to close the dialog box.
The pagination service is added to the mashup.
Paginating Data for the Grid Widget
Next, configure the widgets and create any required bindings. In this example, a Grid widget displays data rows from a nested infotable within the pagination service. The following figure shows the data bindings for the Grid widget.
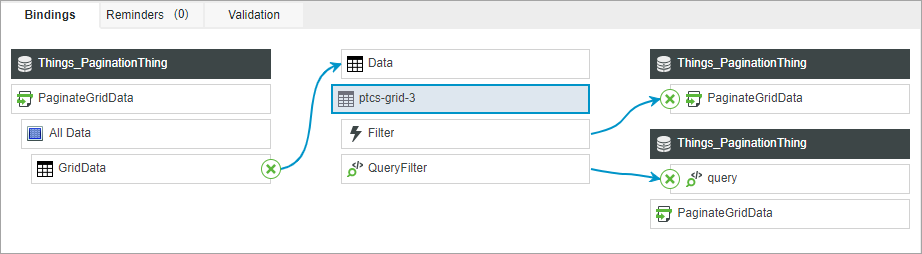
The GridData infotable property of the data service is bound to the Data property of the Grid widget. The Filter event is used to trigger the GetPaginationData service, and the QueryFilter event is bound to the Query input parameter of the service. By default, the grid displays all data from the infotable. To paginate the data on the grid, perform the following steps:
1. Add the Pagination widget to a container on the canvas.
2. Execute the pagination data service using the following events:
◦ Loaded event of the mashup.
◦ Filter event of the Grid widget.
◦ PageNumberChanged event of the Pagination widget.
3. Bind the following Pagination widget properties to the input parameters of the data service:
◦ PageNumber—The current page number. You can also use this property to set the initial page number when the mashup is loaded. By default, the page number is 1.
◦ PageSize—The maximum number of data rows to display on each page.
Data is not stored in the Pagination widget, and it is only used to generate events and provide the parameter values for the pagination data service. |
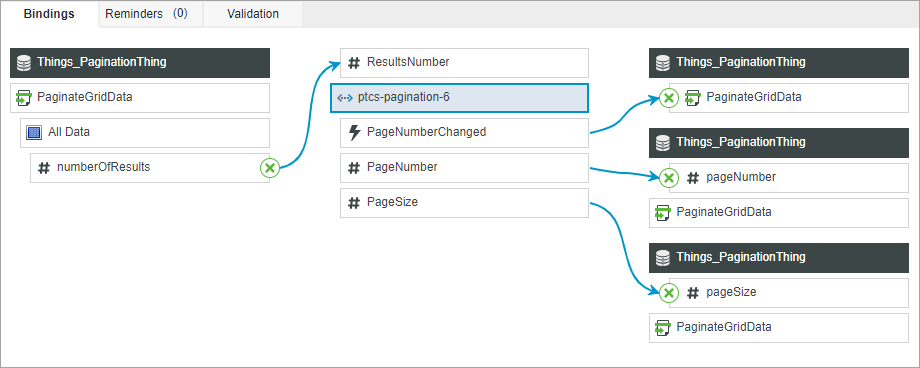
4. Bind the ResultsNumber property from the infotable source to the ResultsNumber property of the widget.
The following figure shows the bindings between the data service and the Pagination widget.
5. Optionally, add a widget to enable users to specify the number of results to display within the grid using the numberOfResults input parameter of the data service.
6. Click Save, and then View Mashup.
View the Widget at Run Time
The Grid displays data that is returned from the data service. The pagination widget shows the total number of results within the infotable and each page displays 10 results. When you click the next or previous page buttons to change the current page, the service is executed using the PageNumberChanged event and data rows are automatically updated.