Bubble Chart Widget
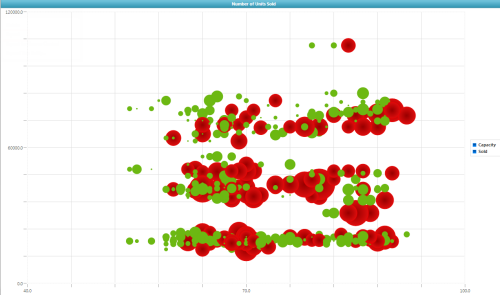
The Bubble Chart widget is a numerical XY chart with an additional property (BubbleValueField) that controls the bubble size. It looks similar to a traditional scatter plot chart and can be used to analyze correlations between data.
As with other chart widgets, you can use state-based or dynamic styling properties to control the style of the bubble. You scale the size of the bubbles using the MinimumBubbleSize and MaximumBubbleSize properties. The chart’s axis values can be configured automatically using the BubbleValueAutoscale, XAxisAutoscale, and YAxisAutoscale properties, or you can manually configure the axis values (the range is 0–10000).
To customize the legend title name, use the BubbleValueLabel field.
Properties
For information about common widget properties, see Widgets. Properties that are specific to the Bubble Chart widget are described in the table below.
|
Property Name
|
Description
|
Base Type
|
Default Value
|
Bindable? (Y/N)
|
Localizable? (Y/N)
|
|---|---|---|---|---|---|
|
CustomClass
|
User defined CSS class to apply to the top div of the widget. Multiple classes can be entered, separated by a space.
|
STRING
|
n/a
|
Y
|
N
|
|
Data
|
Data source for the widget.
|
INFOTABLE
|
n/a
|
Y
|
N
|
|
XAxisField
|
The source for the x-axis data.
|
MENUNAME
|
n/a
|
Y
|
N
|
|
YAxisField
|
The source for the y-axis data.
|
MENUNAME
|
n/a
|
Y
|
N
|
|
BubbleValueField
|
The source for the bubble value data.
|
MENUNAME
|
n/a
|
Y
|
N
|
|
ChartTitle
|
The name of the chart.
|
STRING
|
n/a
|
Y
|
Y
|
|
ShowLegend
|
Displays the chart legend.
|
BOOLEAN
|
True
|
N
|
N
|
|
LegendWidth
|
The width of the legend.
|
BOOLEAN
|
0
|
N
|
N
|
|
LegendLocation
|
The location of the legend (Right, Left, Top, Bottom).
|
STRING
|
Right
|
N
|
N
|
|
LegendOrientation
|
The orientation of the legend (Vertical or Horizontal).
|
STRING
|
Vertical
|
N
|
N
|
|
MinimunBubbleSize
|
The minimum size of the bubble.
|
NUMBER
|
4
|
N
|
N
|
|
MaximumBubbleSize
|
The maximum size of the bubble.
|
NUMBER
|
80
|
N
|
N
|
|
ShowXAxis
|
Display the x-axis.
|
BOOLEAN
|
True
|
N
|
N
|
|
XAxisFormat
|
The format of the x-axis.
|
STRING
|
0000.0
|
N
|
N
|
|
XAxisMinimum
|
The x-axis minimum.
|
NUMBER
|
n/a
|
Y
|
N
|
|
XAxisMaximum
|
The x-axis maximum.
|
NUMBER
|
n/a
|
N
|
N
|
|
XAxisAutoscale
|
Automatically scale the x-axis.
|
BOOLEAN
|
True
|
N
|
N
|
|
XAxisZeroscale
|
X-axis zeroscale option.
|
NUMBER
|
n/a
|
Y
|
N
|
|
XAxisSmoothScaling
|
Attempt to use round values to scale the x-axis.
|
BOOLEAN
|
True
|
N
|
N
|
|
XAxisIntervals
|
Number of x-axis chart intervals (affects ticks and grid).
|
NUMBER
|
10
|
N
|
N
|
|
XAxisMinorTicks
|
The number of x-axis minor ticks.
|
NUMBER
|
1
|
N
|
N
|
|
XAxisLabels
|
The number of x-axis labels.
|
NUMBER
|
2
|
N
|
N
|
|
ShowXAxisLabels
|
Display x-axis labels.
|
BOOLEAN
|
True
|
N
|
N
|
|
ShowXAxisTicks
|
Display x-axis tick marks.
|
BOOLEAN
|
True
|
N
|
N
|
|
AllowXAxisZoom
|
Allow zooming on the x-axis.
|
BOOLEAN
|
True
|
N
|
N
|
|
ShowYAxis
|
Display the y-axis.
|
BOOLEAN
|
True
|
N
|
N
|
|
YAxisIntervals
|
The number of y-axis intervals (affects ticks and grid).
|
NUMBER
|
10
|
N
|
N
|
|
YAxisMinorTicks
|
The number of y-axis minor ticks.
|
NUMBER
|
1
|
N
|
N
|
|
YAxisLabels
|
The number of y-axis labels.
|
NUMBER
|
2
|
N
|
N
|
|
ShowYAxisLabels
|
Display the y a-axis labels.
|
BOOLEAN
|
True
|
N
|
N
|
|
ShowYAxisTicks
|
Display the y-axis tick marks.
|
BOOLEAN
|
True
|
N
|
N
|
|
AllowYAxisZoom
|
Allow zooming on the y-axis.
|
BOOLEAN
|
True
|
N
|
N
|
|
YAxisFormat
|
The format for the y-axis values.
|
STRING
|
0000.0
|
N
|
N
|
|
YAxisMinimum
|
The minimum value for the y-axis.
|
NUMBER
|
0
|
Y
|
N
|
|
YAxisMaximum
|
The maximum value for the y-axis.
|
NUMBER
|
100
|
Y
|
N
|
|
YAxisAutoscale
|
Automatically scale the y-axis.
|
BOOLEAN
|
True
|
N
|
N
|
|
YAxisZeroscale
|
Force a zero minimum when automatically scaling the y-axis.
|
BOOLEAN
|
False
|
N
|
N
|
|
BubbleValueFormat
|
The format for the secondary y-axis values.
|
STRING
|
0000.0
|
N
|
N
|
|
BubbleValueMinimum
|
The minimum value for the secondary y-axis values.
|
NUMBER
|
0
|
Y
|
N
|
|
BubbleValueMaximum
|
The maximum value for the secondary y-axis values.
|
NUMBER
|
100
|
Y
|
N
|
|
BubbleValueAutoscale
|
Automatically scale the secondary y-axis.
|
BOOLEAN
|
True
|
N
|
N
|
|
BubbleValueZeroscale
|
Force a zero minimum when automatically scaling the secondary y-axis.
|
BOOLEAN
|
False
|
N
|
N
|
|
AllowSelection
|
Allow item selection.
|
BOOLEAN
|
True
|
N
|
N
|
|
EnableHover
|
Enable display of values on hover.
|
BOOLEAN
|
True
|
N
|
N
|
|
ShowXAxisGrid
|
Display horizontal grid.
|
BOOLEAN
|
True
|
N
|
N
|
|
ShowYAxisGrid
|
Display vertical grid.
|
BOOLEAN
|
True
|
N
|
N
|
|
ShowDataLoading
|
Displays a spinning icon when data is loading.
|
BOOLEAN
|
True
|
N
|
N
|
|
DoubleClicked
|
Event that triggers when widget is double-clicked.
|
n/a
|
True
|
N
|
N
|
|
Visible
|
Is the widget visible in run time?
|
BOOLEAN
|
True
|
Y
|
N
|